Maritime / Defense Simulation

Shipyard Operations Planning

A planning engagement for shipyard refit and overhaul operations. Simulation is one stage of the workflow, used to model the facility as it actually operates, surface capacity and labor conflicts before they reach the deck, and forecast how schedule compression and delay propagation affect commitments across the refit pipeline.

Performance emerges from the interaction of constraints

For shipyard operations, performance is not determined by any single resource. It emerges from the interaction between vessels, docks, drydock bays, cranes, travel lifts, labor trades, material supply, shop throughput, safety constraints, weather exposure, and cross-yard coordination.

A useful shipyard simulation moves in stages: facility geometry, vessel-state progression, equipment capacity, labor and material readiness, cross-yard coordination, schedule forecasting, safety risk, and live telemetry calibration. Each stage answers a different question.

The purpose is not heatmaps or schedule charts. The purpose is to understand where performance changes, why it changes, and what operational decisions should be made before constraints become field-level delays.
Each layer depends on the one before it

A facility model without vessel-state progression shows where vessels are, but not whether they can transition to the next phase. A capacity analysis without labor and material readiness shows where assets are needed, but not whether they will be available when called. A schedule without cross-yard load balancing optimizes one facility while another is starving.

The sequence matters because every layer changes the answer. A model that stops at facility geometry misses operational throughput. A model that stops at capacity misses delay propagation under realistic schedule pressure. A model that stops before telemetry calibration cannot improve from the yard's actual operating record.

The simulation workflow is designed to expose the interactions between these layers, because that is where most shipyard delivery risk actually lives.

Nine stages. Each one answering a different question.

The simulation moves from facility geometry to live telemetry calibration. Each stage below produces a specific artifact and answers a specific operational question. Figures shown are representative. Actual outputs are produced against the specific yard, vessel mix, and refit pipeline being modeled.

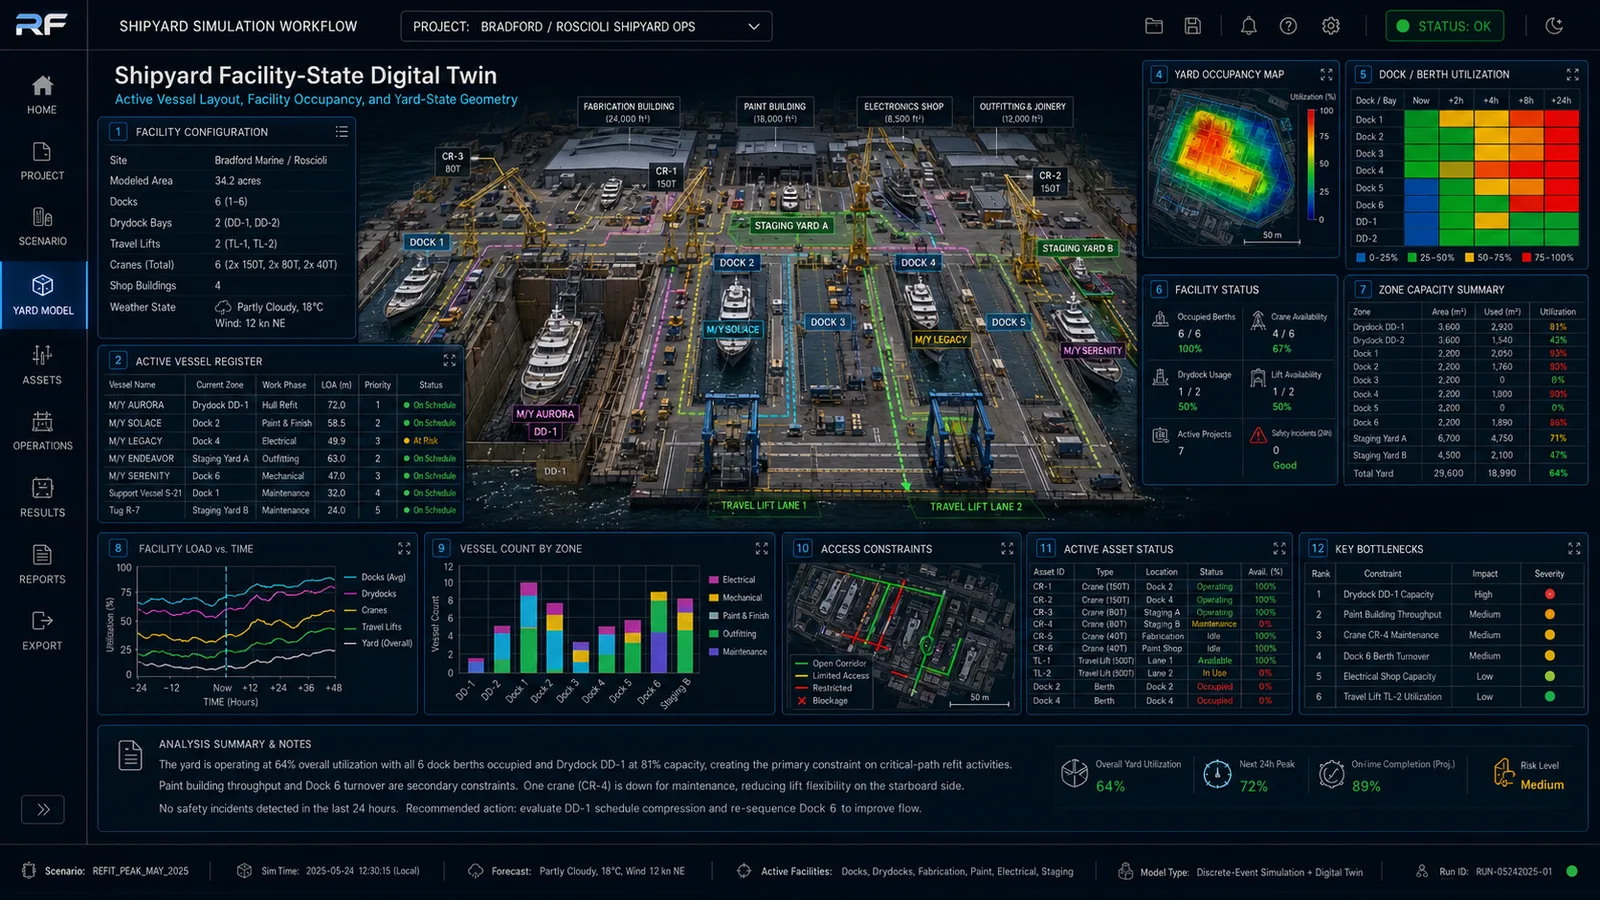
01 /Facility-State Digital Twin and Active Vessel Layout
Physical baseline before capacity, labor, and schedule are evaluated.

The digital twin stage establishes the spatial and physical model of the yard: dock and drydock configuration, building locations, travel-lift paths, crane positions, laydown areas, and the current vessel layout. This is the geometric truth against which every later stage is evaluated.

Without this layer, downstream analyses become detached from yard reality. Capacity plans built on incomplete geometry routinely miss the constraints that the actual yard imposes.

Shipyard facility-state digital twin
FIG 01Shipyard Facility-State Digital Twin · Active Vessel Layout · Yard Occupancy and Access Geometry

NoteActual outputs reflect the specific yard footprint, dock and drydock configuration, building locations, travel-lift paths, crane positions, and current vessel positions.

02 /Vessel Refit-State Progression and Transition Dependency Model
Operational context for the vessels in the yard.

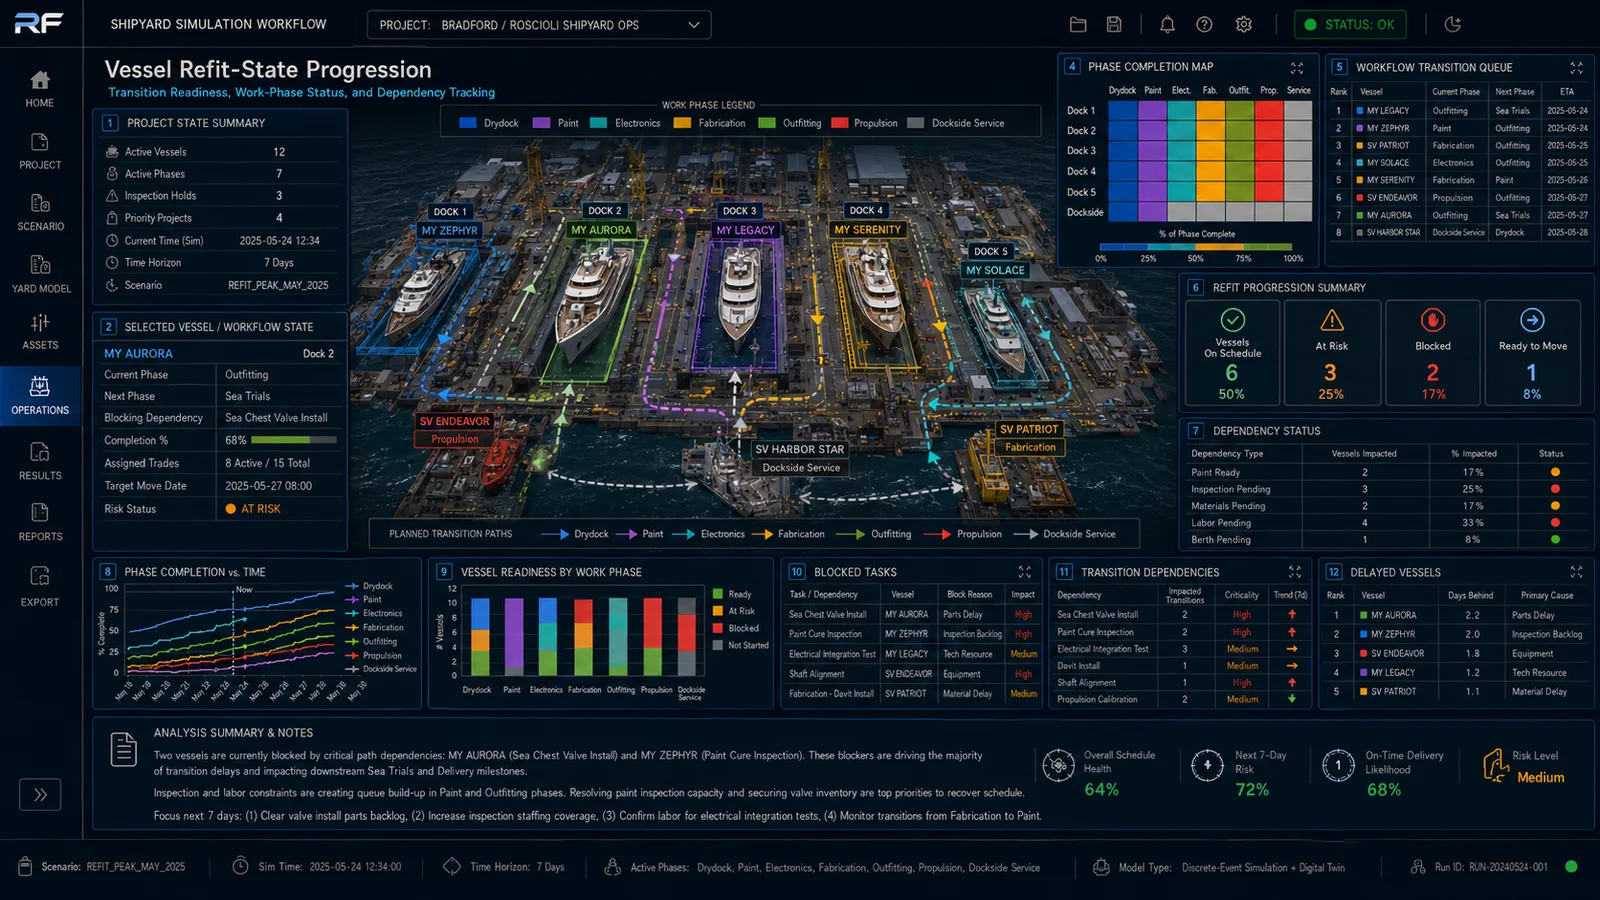
The vessel-state model adds operational context to physical geometry. Each vessel's refit phase, work-package status, transition readiness, and blocking dependencies are tracked against the refit timeline. The model exposes which transitions are ready to fire and which are blocked.

Per-vessel phase completion, transition dependency maps, blocked task tables, and workflow transition queues anchor downstream capacity and labor analyses.

Vessel refit-state progression and transition dependency
FIG 02Vessel Refit-State Progression · Work-Phase Status · Transition Readiness and Blocked Dependency Tracking

NoteActual outputs include per-vessel phase completion, transition dependency maps, blocked task tables, and workflow transition queues calibrated to the project roster and work scope being modeled.

03 /Lift, Dock, Crane, and Berth Capacity Conflict Simulation
High-demand movement assets modeled against the current schedule.

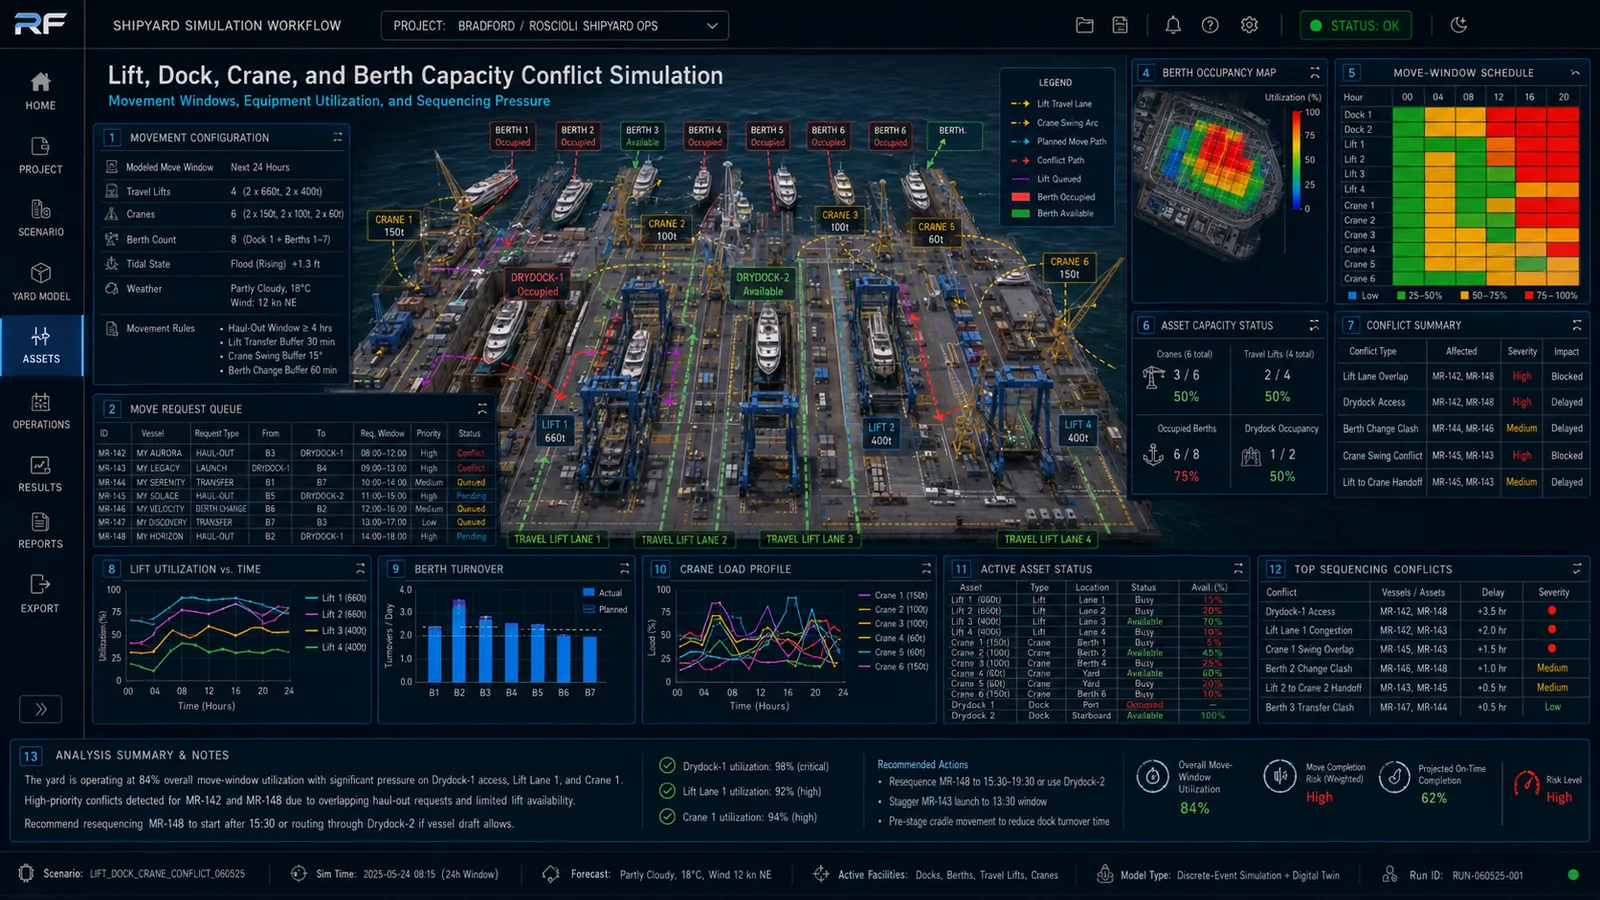
Travel lifts, cranes, and berths are evaluated against the active refit schedule. The simulation surfaces move-request queues, berth occupancy patterns, crane load profiles, and lift utilization over time. Sequencing pressure and equipment conflicts are quantified rather than left to yard-manager intuition.

Where two refits will compete for the same resource is shown in the model, along with the sequencing changes that recover capacity.

Lift, dock, crane, and berth capacity conflict simulation
FIG 03Lift, Dock, Crane & Berth Capacity · Movement Windows · Sequencing Pressure and Equipment Conflict

NoteActual outputs show move-request queues, berth occupancy heat maps, crane load profiles, lift utilization vs. time, and top sequencing conflicts for the specific yard geometry, equipment roster, and refit schedule being modeled.

04 /Trade Availability, Crew Movement, and Labor Conflict Model
Schedules frequently assume that work can proceed because the calendar allows it. The labor model tests that assumption.

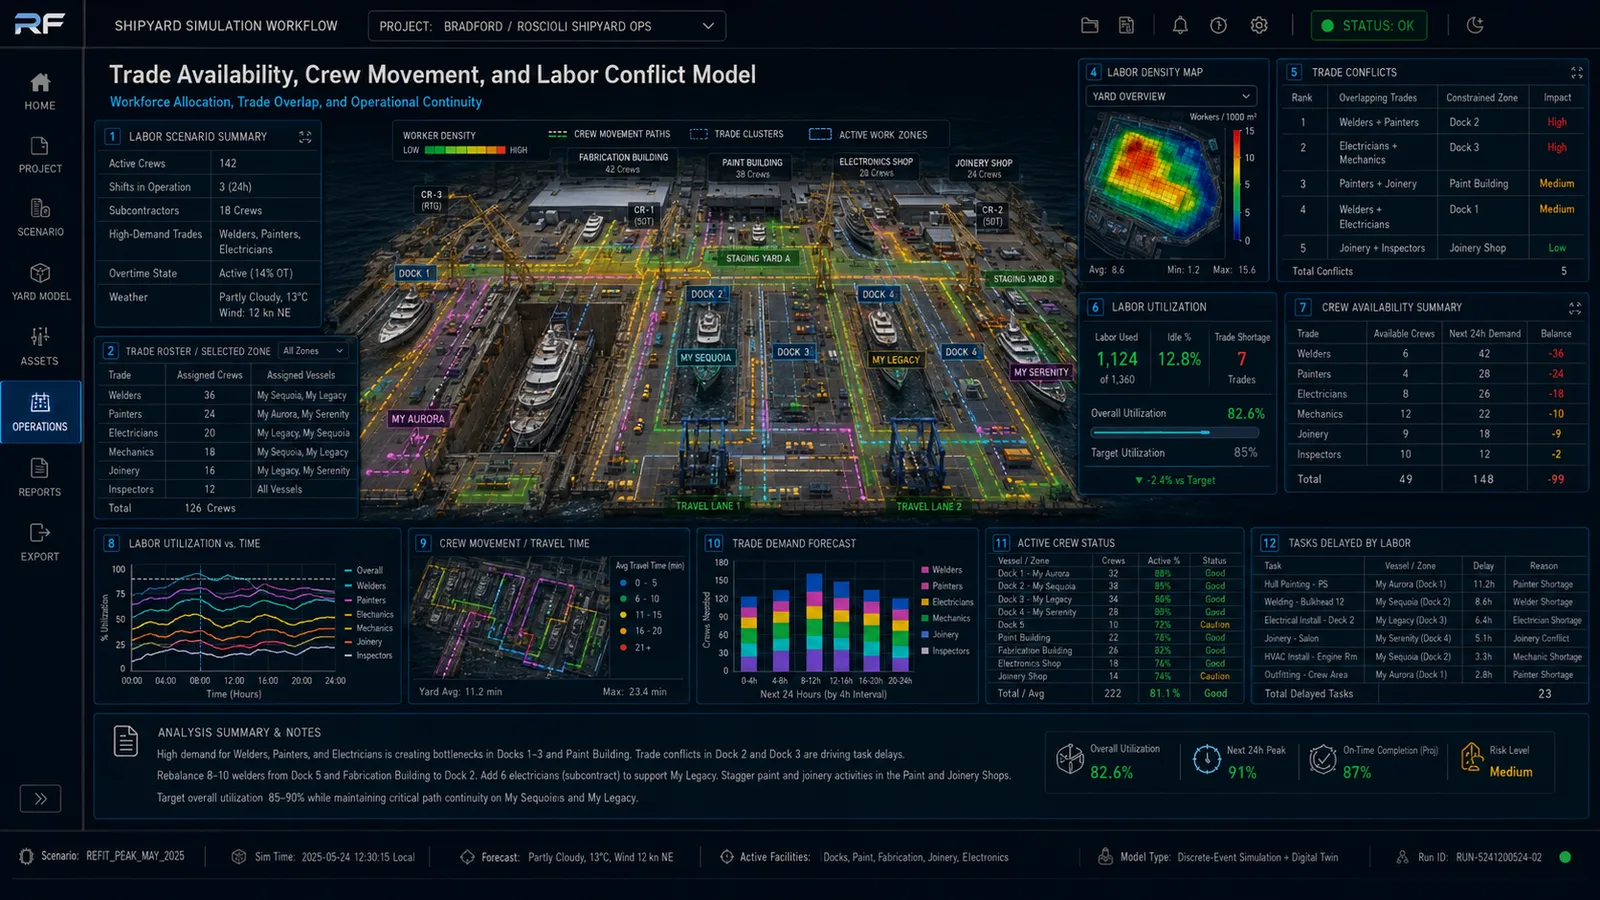
Trade rosters, crew movement, worker density, and travel time between work zones are evaluated against the refit schedule. Tasks that are delayed by labor availability are identified before they become field-level standby.

Labor density maps, trade availability summaries, crew movement visualization, and trade demand forecasts support staffing and shift-planning decisions backed by the actual yard layout.

Trade availability, crew movement, and labor conflict
FIG 04Trade Availability & Labor Conflict · Worker Density Overlay · Trade Roster and Crew Movement Simulation

NoteActual outputs include labor density maps, trade availability summaries, tasks delayed by labor, crew movement and travel time visualization, and trade demand forecasts calibrated to the labor roster being modeled.

05 /Material Readiness, Shop Queue, and Refit Throughput Simulation
Labor and physical space do not matter if critical parts are not in the shop.

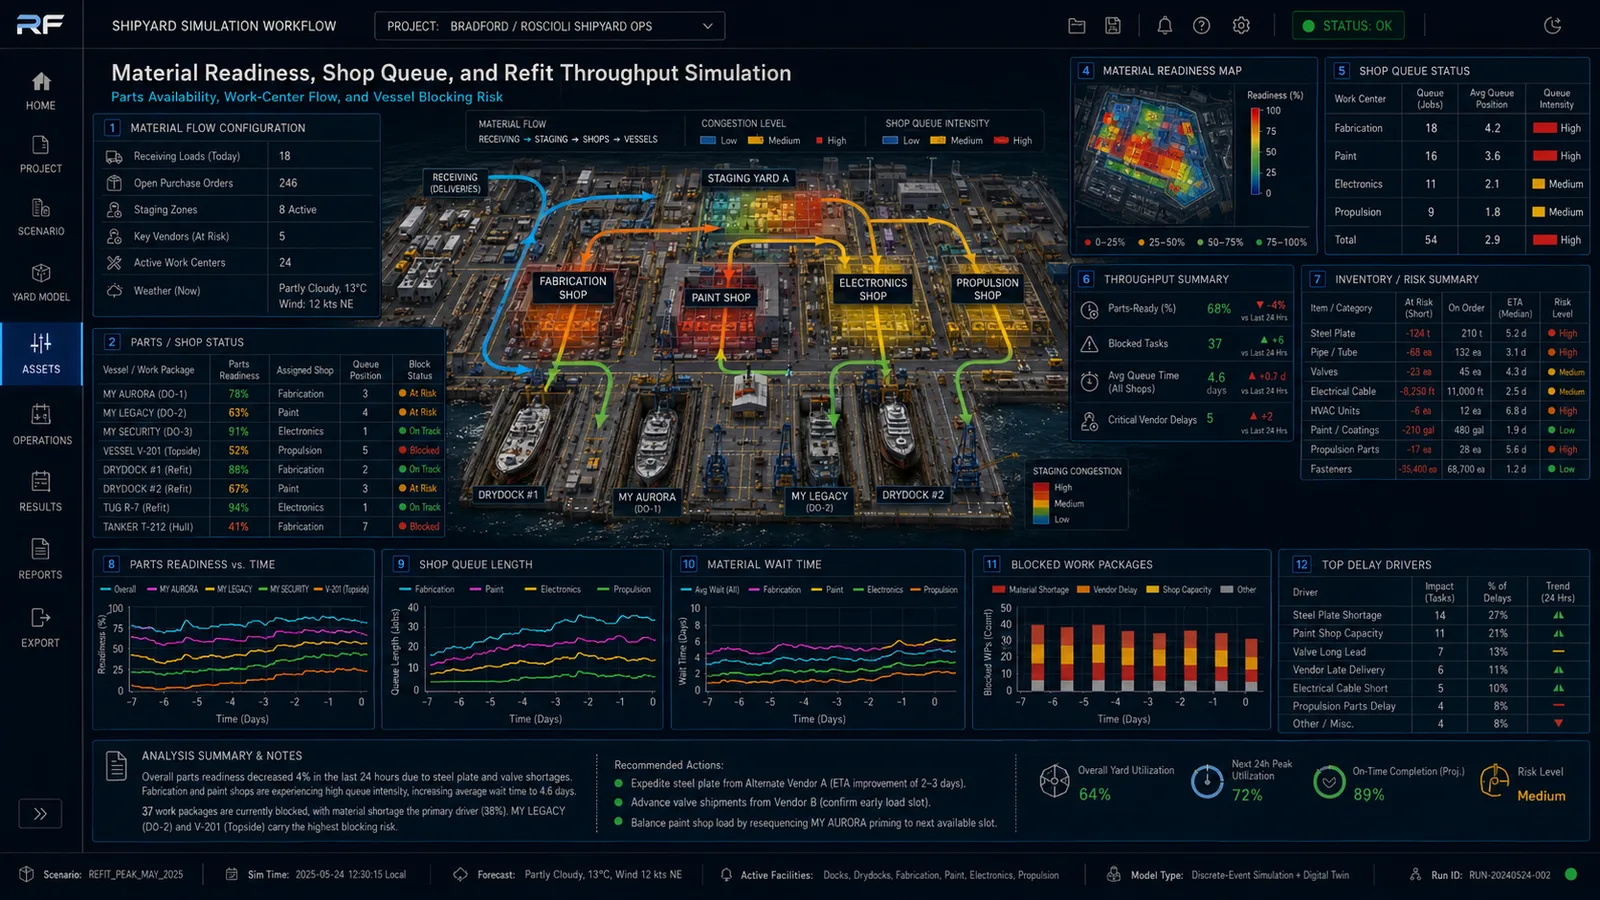
Material availability, shop queue intensity, work-center flow, and parts arrival are modeled against the refit pipeline. Blocked work packages and shop bottlenecks are surfaced before they cascade into vessel-blocking delays.

Material readiness maps by vessel and shop, shop queue charts, blocked work-package tables, top delay drivers, and recommended expediting actions translate purchasing decisions into operational outcomes.

Material readiness, shop queue, and refit throughput
FIG 05Material Readiness & Shop Queue · Parts Availability · Work-Center Flow and Vessel Blocking Risk

NoteActual outputs include material readiness maps by vessel and shop, shop queue intensity charts, blocked work package tables, top delay drivers, and recommended expediting actions calibrated to the purchasing and shop data being modeled.

06 /Cross-Yard Synchronization and Distributed Facility Load Model
When two facilities operate as a coordinated system.

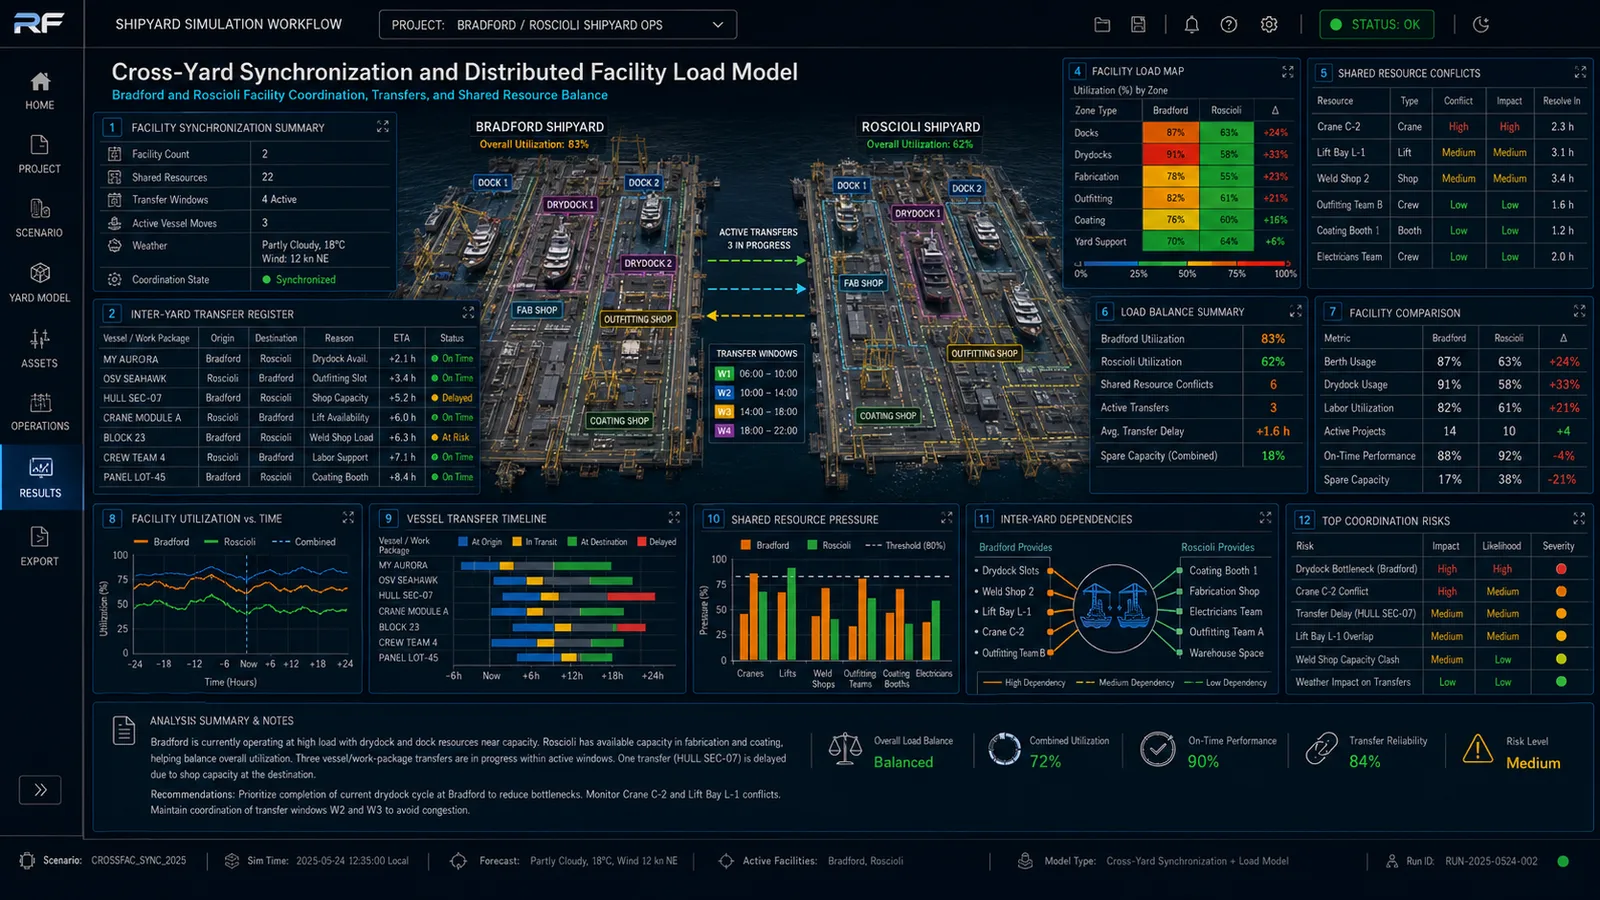
For operators with multiple facilities, the model evaluates cross-yard load balancing, vessel transfers, shared resources, and parallel work plans against a unified view rather than against phone calls between yard managers. Pressure on shared resources is quantified, and coordination risk is ranked.

Dual-yard facility load maps, inter-yard transfer registers, vessel transfer timelines, and coordination risk rankings support load-balancing decisions that smooth the network rather than optimizing a single yard.

Cross-yard synchronization and distributed facility load
FIG 06Cross-Yard Synchronization · Multi-Yard Coordination · Distributed Facility Load and Shared Resource Balance

NoteActual outputs show dual-yard facility load maps, inter-yard transfer registers, vessel transfer timelines, shared resource pressure charts, and coordination risk rankings calibrated to the specific multi-yard operation being modeled.

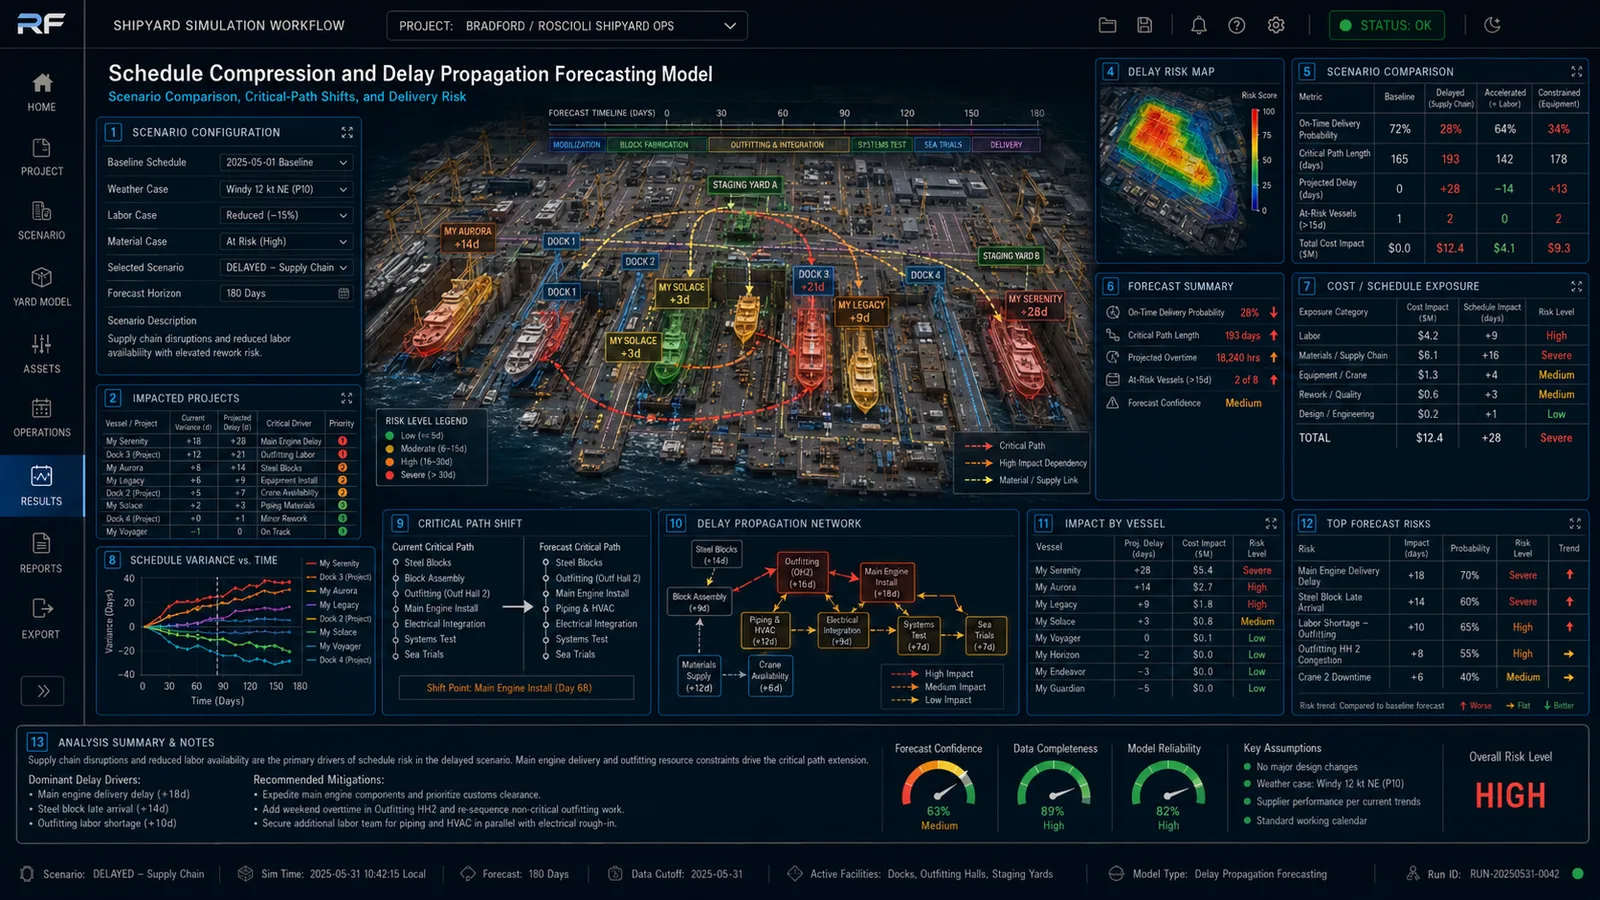
07 /Schedule Compression and Delay Propagation Forecasting Model
A single delayed task can shift dock occupancy, labor allocation, shop queueing, and downstream vessel handoffs.

The simulation forecasts how delays propagate through the refit pipeline. Scenario comparisons, critical-path shifts, delay-propagation networks, schedule variance over time, and cost and schedule exposure rankings show how mitigation choices affect the full yard.

Mitigation decisions are made against the model rather than against the local task, and commercial commitments are negotiated against analyzed risk rather than assumed risk.

Schedule compression and delay propagation forecasting
FIG 07Schedule Compression & Delay Propagation · Scenario Comparison · Critical-Path Shifts and Delivery Risk

NoteActual outputs include scenario comparison tables, delay propagation networks, critical path shift diagrams, schedule variance vs. time charts, and cost and schedule exposure rankings calibrated to the yard schedule being modeled.

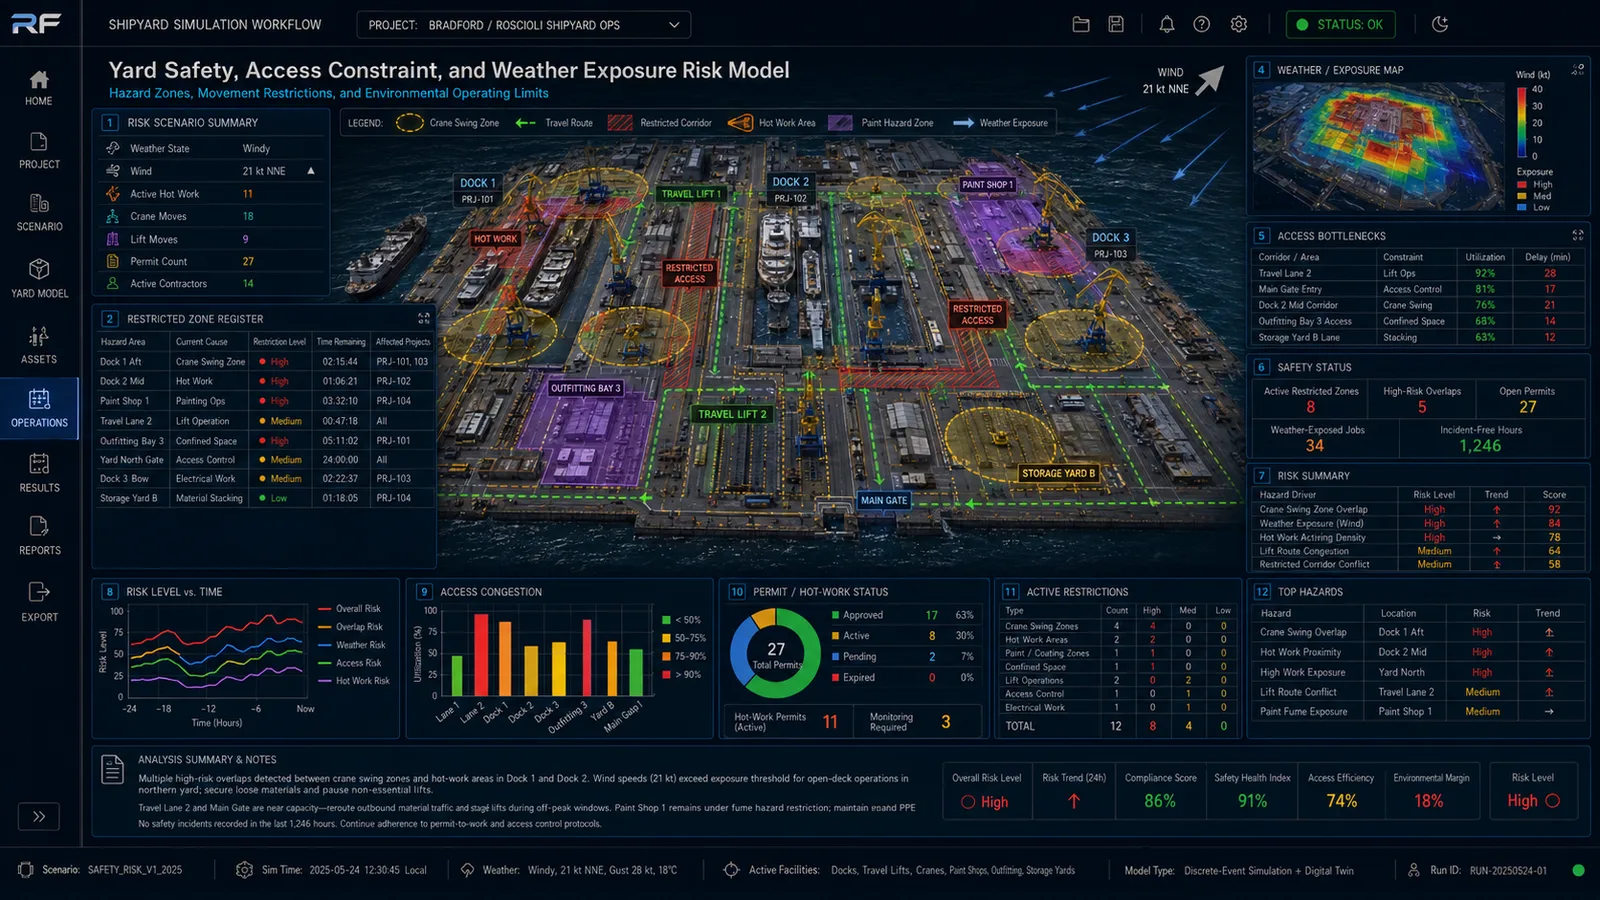
08 /Yard Safety, Access Constraint, and Weather Exposure Risk Model
Operational risk in a shipyard often emerges from overlapping hazards and weather windows.

Hazard zones, movement restrictions, environmental operating limits, and weather exposure are evaluated against the active refit pipeline. Safety overlays, weather exposure maps, access bottleneck tables, and hazard rankings support both operational and insurance conversations.

Risks are made visible against the schedule, so mitigation is planned rather than discovered when conditions change.

Yard safety, access constraint, and weather exposure risk
FIG 08Yard Safety & Access Constraint · Hazard Zones · Movement Restrictions and Environmental Operating Limits

NoteActual outputs include safety-overlay views with hazard zone registers, weather exposure maps, access bottleneck tables, risk level vs. time charts, and top hazard rankings calibrated to the active projects and yard environment being modeled.

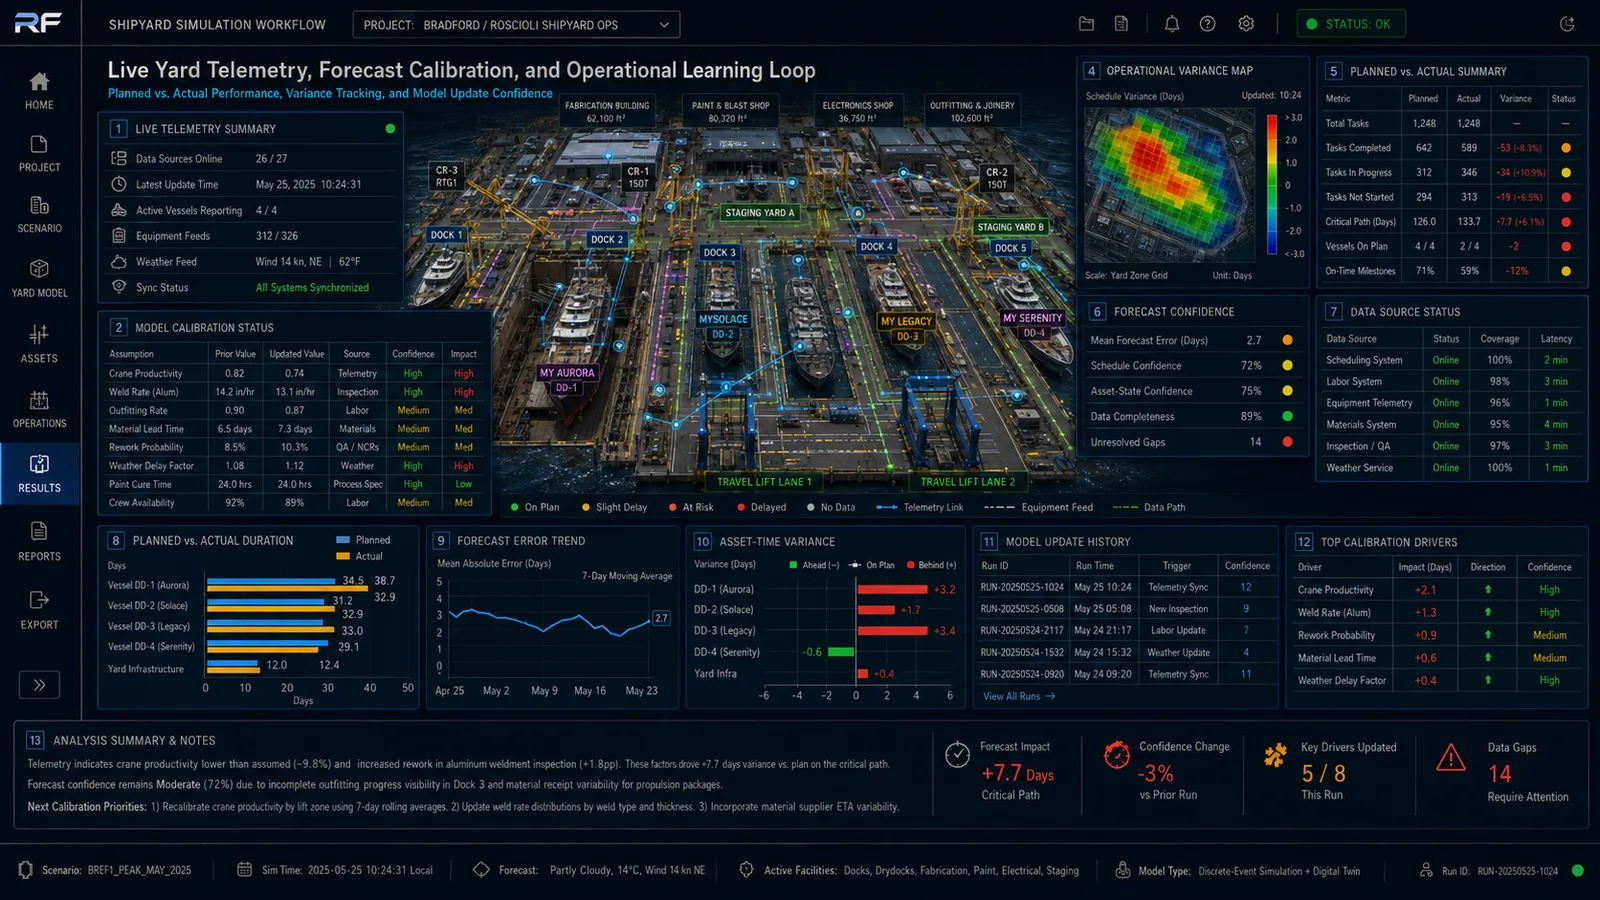
09 /Live Yard Telemetry, Forecast Calibration, and Operational Learning Loop
Simulation becomes most valuable when it is connected to live yard data.

Live yard telemetry, completion data, equipment utilization, throughput, and safety incidents are compared against predicted performance. Live yard-state views, model calibration tables, planned-versus-actual summaries, operational variance maps, and forecast confidence panels show where the model is accurate and where it needs refinement.

Each refit campaign becomes structured knowledge that sharpens the next forecast. The planning library compounds across the yard's portfolio.

Live yard telemetry and forecast calibration
FIG 09Live Yard Telemetry & Forecast Calibration · Operational Learning Loop · Model Update Confidence and Variance Tracking

NoteActual outputs include live yard-state views, model calibration tables, planned vs. actual summaries, operational variance maps, forecast confidence panels, and top calibration driver rankings derived from the yard's live operating data.

Capacity you can commit to

The simulation stages feed a small set of consequential decisions. The outcomes below are what yard leadership carries into capacity commitments, into customer conversations, and into contract negotiations.

01 /Throughput Per Yard-Day
Surface the bottlenecks that the schedule hides.

Bottlenecks across cranes, drydocks, travel-lift paths, labor trades, and material supply surface in the model rather than during execution. Capacity that the existing schedule fails to use becomes visible. The result is more vessels through the yard per month against the same physical and labor footprint, without overcommitting on dates the operation cannot actually hold.

02 /Predictable Delivery Windows
Repeat business runs on dates the yard can hold.

Shipyard customers, including owners, operators, and insurers, return to yards that deliver vessels on the dates they were promised. Simulation supports honest, defensible commitment dates by modeling the conflicts and constraints that drive slippage before they accumulate. Marketing the yard's reliability becomes a credible claim backed by analysis, not a forward-looking statement that the next late delivery undermines.

03 /Cross-Yard Load Balancing
Allocate against modeled load, not last week's schedule.

For operators with multiple facilities, simulation reveals where work can shift between yards to relieve a constraint. Vessel transfers, shared resources, and parallel work plans are evaluated against a unified model rather than against a phone call between yard managers. The result is smoother load across the network and fewer cases where one yard is starving while another is overcommitted.

04 /Penalty and Schedule Risk Reduction
Quantify exposure before the contract is signed.

Penalty clauses for late delivery are a known feature of shipyard contracts; their cost is asymmetric. Simulation quantifies schedule-slip exposure against the operator's specific yard, vessel mix, and supply chain before the contract is signed, so commercial terms are negotiated against analyzed risk rather than assumed risk. The downstream effect is fewer surprise penalty events and tighter margin on jobs the operator can actually deliver.

Where simulation does not solve the problem alone

Simulation does not replace external commitments, what demolition uncovers, or the judgment of foremen and trade crews. The boundaries below are explicit so the deliverable is read accurately.

01 /External Dependencies Are Not Modeled
Owners, suppliers, classification societies, and weather drive outcomes outside the yard.

The simulation models yard capacity, vessel-state progression, equipment, and labor. Owner-side decisions about scope changes, supplier delivery delays, classification society inspection timing, customs clearance, and weather windows that affect launches and sea trials are outside the model. A well-planned yard schedule still depends on these external commitments holding.

02 /Hidden Vessel Defects Are Out of Scope
What demolition uncovers cannot be modeled in advance.

Existing conditions discovered when a vessel is opened up, hidden corrosion, prior repair quality, undocumented modifications, and structural surprises are by definition outside the input model. The simulation can be updated when new information arrives, but it cannot foresee what the refit has not yet exposed. Surveys, inspections, and reserve scope budgets remain the way to manage what the model cannot predict.

03 /Labor and Subcontractor Behavior Is Not Modeled
The model assumes the labor plan holds; it does not predict the people.

Trade availability, subcontractor scheduling, foreman judgment, and the informal coordination that happens on a real yard are inputs to the model, not outputs of it. The simulation can show where labor density or trade overlap creates risk; it cannot predict whether a specific crew will be present, how quickly a subcontractor will mobilize, or which informal accommodation will be made when conflict arises. Field intelligence remains required to interpret model output.

Integrating Simulation into Shipyard Refit Operations

Simulation is integrated at the shipyard planning layer, before vessel refit sequencing is locked or yard capacity is committed to a contract. Each engagement begins with a scoping call to define the operating envelope: yard layout, active vessel mix, refit-state progression, lift, dock, crane, and berth inventory, trade roster, material readiness pipeline, cross-yard coordination needs, and the delivery commitments the deliverable must support.

Yard geometry, vessel state, and operational constraints are then captured as a working model, and the simulation stages run against the actual refit cases the yard expects to execute. Deliverables include the facility-state digital twin and active vessel layout, vessel refit-state progression and transition dependencies, lift, dock, crane, and berth capacity conflict simulation, trade availability and labor conflict analysis, material readiness and shop-queue throughput predictions, cross-yard synchronization and distributed facility load model, schedule compression and delay-propagation forecasts, yard safety and weather-exposure risk evaluation, and a written brief that documents the analysis for yard leadership, vessel owners, and the insurance underwriter.

As the yard executes more refit campaigns, the planning record grows. Post-deployment telemetry from yard operations and forecast calibration informs the next round of planning, and the simulation library becomes an internal asset that yard leadership carries from one campaign to the next.

Planning a Refit Campaign?

For commercial yards, defense refit facilities, and multi-yard operators, we bring layered simulation across facility state, vessel progression, capacity, labor, and schedule, so delivery commitments are backed by analyzed capacity rather than calendar arithmetic.