Maritime / Public Safety Simulation

Ferry IoT & Emergency Response Planning

A planning engagement for passenger-ferry IoT and emergency-response deployments. Simulation is one stage of the workflow, used to model the vessel as it actually operates, evaluate communications across route and dock transitions, and stress-test passenger evacuation and responder access before commissioning.

Simulation as an engineering sequence

Simulation is most valuable when it follows an IoT deployment from its smallest technical assumptions through its real operating environment. The system type is consistent across applications: distributed devices, an RF backbone, and a physical and human context that determines whether the system actually works in the field.

The representative use case carried through this engagement is passenger-ferry emergency response, where performance is not determined by any single component. It emerges from the interaction between the communications hardware, the vessel structure, the route, the dock, the shore network, the passengers on board, the responders, and the operating conditions on the day of the incident.

A useful workflow moves in stages: spatial geometry and antenna characterization, deck-level integration, coastal propagation, dock-transition handoff, uplink and downlink coverage, passenger evacuation, and operational readiness under degraded conditions. The purpose is not coverage maps or evacuation curves. The purpose is to understand where performance changes, why it changes, and what design or deployment decisions should be made before the vessel carries passengers.
Each layer changes the answer

An IoT deployment is a layered system. The communications layer determines whether alerts, telemetry, commands, and responder coordination data can move reliably. The vessel-structure layer determines where signals are blocked, reflected, absorbed, or detuned by decks, bulkheads, engine spaces, and superstructure. Each step outward from the vessel adds its own constraints.

The route layer determines whether shore connectivity remains available while the vessel moves across open water and along coastal terrain. The dock-transition layer determines whether coverage and handoff remain reliable during one of the most operationally complex phases of ferry service. Once an incident occurs, the problem expands. The vessel is moving, passengers are moving, weather is changing, and dock structures obstruct signals. The link may transition between line-of-sight and non-line-of-sight conditions across short distances.

A model that stops at antenna performance misses vessel loading effects. A model that stops at propagation misses dock-transition handoffs. A model that stops at RF misses the passenger and responder behavior that turns communications into safe action. The most expensive failures are not device failures; they are integration failures.

Nine stages. Each one answering a different question.

The simulation moves from vessel geometry through coastal propagation, dock handoff, and passenger evacuation. Each stage below produces a specific artifact and answers a specific operational question. Figures shown are representative. Actual outputs are produced against the specific vessel, route, and emergency operating envelope being modeled.

01 /Ferry Digital Twin and Emergency-Zone Geometry
Spatial model that every later stage is evaluated against.

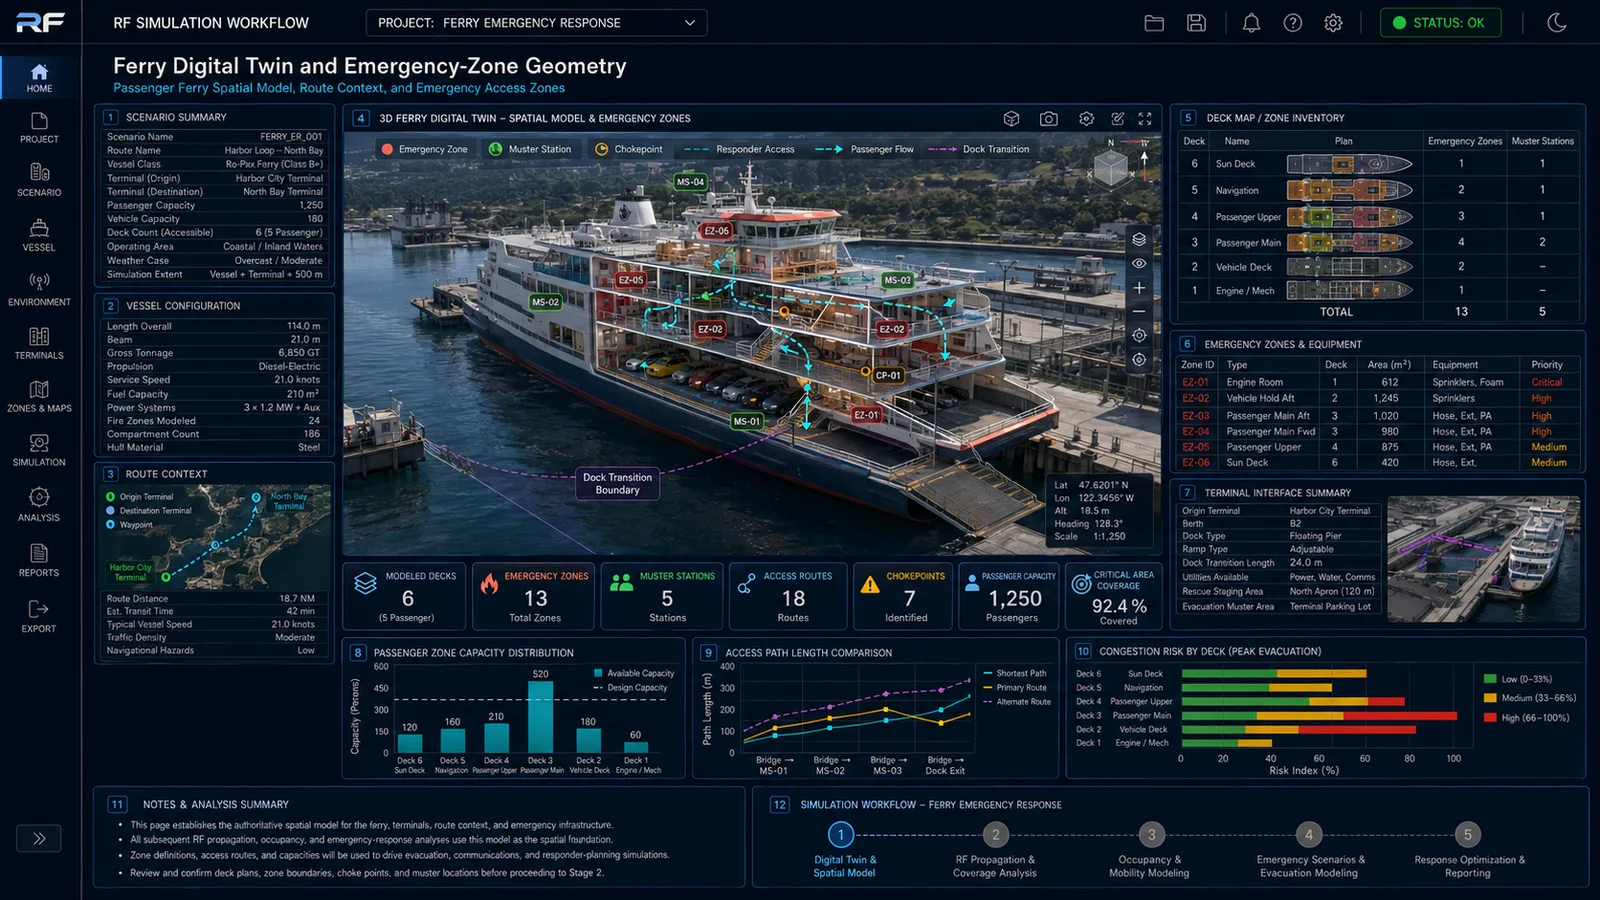
The digital-twin stage establishes the spatial model: vessel structure, decks, mustering areas, egress paths, dock interfaces, route context, and emergency-zone inventory. This is the baseline for both communications and evacuation modeling.

Without this layer, downstream analyses become detached from operational reality. Coverage and evacuation results built on incomplete geometry routinely overstate what the system can actually do.

Ferry digital twin and emergency-zone geometry
FIG 01Ferry Digital Twin & Emergency-Zone Geometry · Spatial Model · Route Context · Emergency Access Zones

NoteActual outputs reflect the specific vessel class, route, terminal configuration, deck plans, and emergency-zone inventory being modeled.

02 /Onboard Antenna and Emergency Gateway Characterization
Baseline RF behavior of emergency communications hardware.

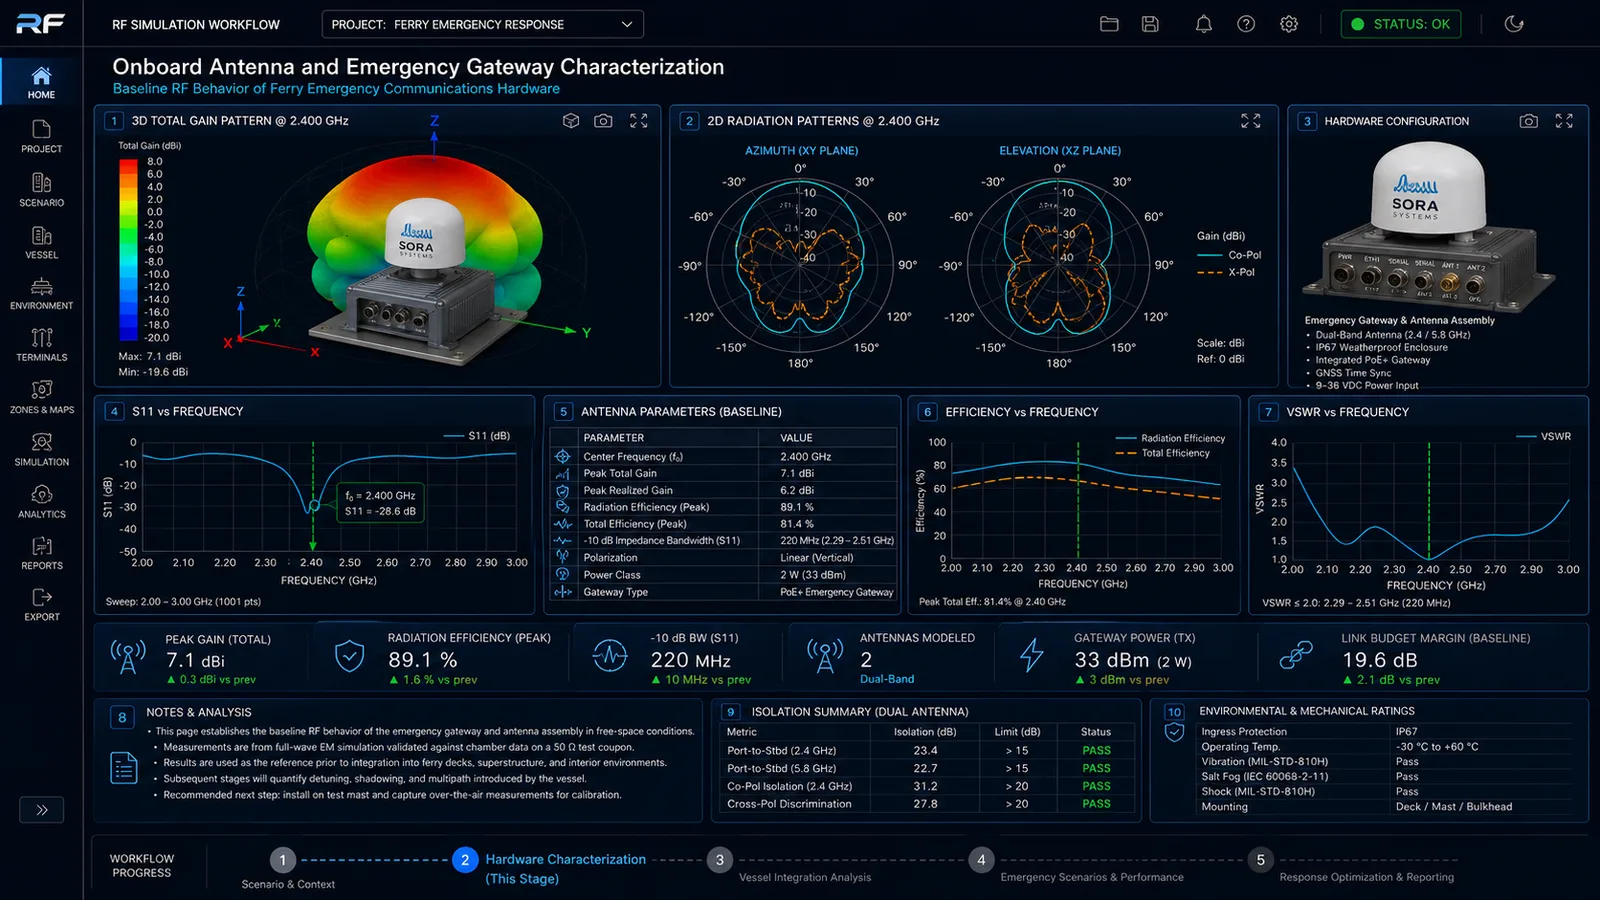
The hardware-characterization stage establishes the baseline behavior of onboard antennas and emergency gateways before they are integrated onto the vessel. Radiation pattern, S11, efficiency, VSWR, and link-budget margin are documented in isolation as the reference against which integration losses are evaluated.

The result is a known starting point: what the equipment can do at its best, before vessel structure and deck loading reshape its behavior.

Onboard antenna and emergency gateway characterization
FIG 02Onboard Antenna & Emergency Gateway Characterization · Baseline RF Behavior of Emergency Communications Hardware

NoteActual outputs show radiation patterns, S11, efficiency, VSWR, and link-budget margin for the specific antenna and gateway configuration being modeled.

03 /Deck-Level Device Integration and Structural Loading Effects
Vessel structure reshapes communications performance once equipment is installed.

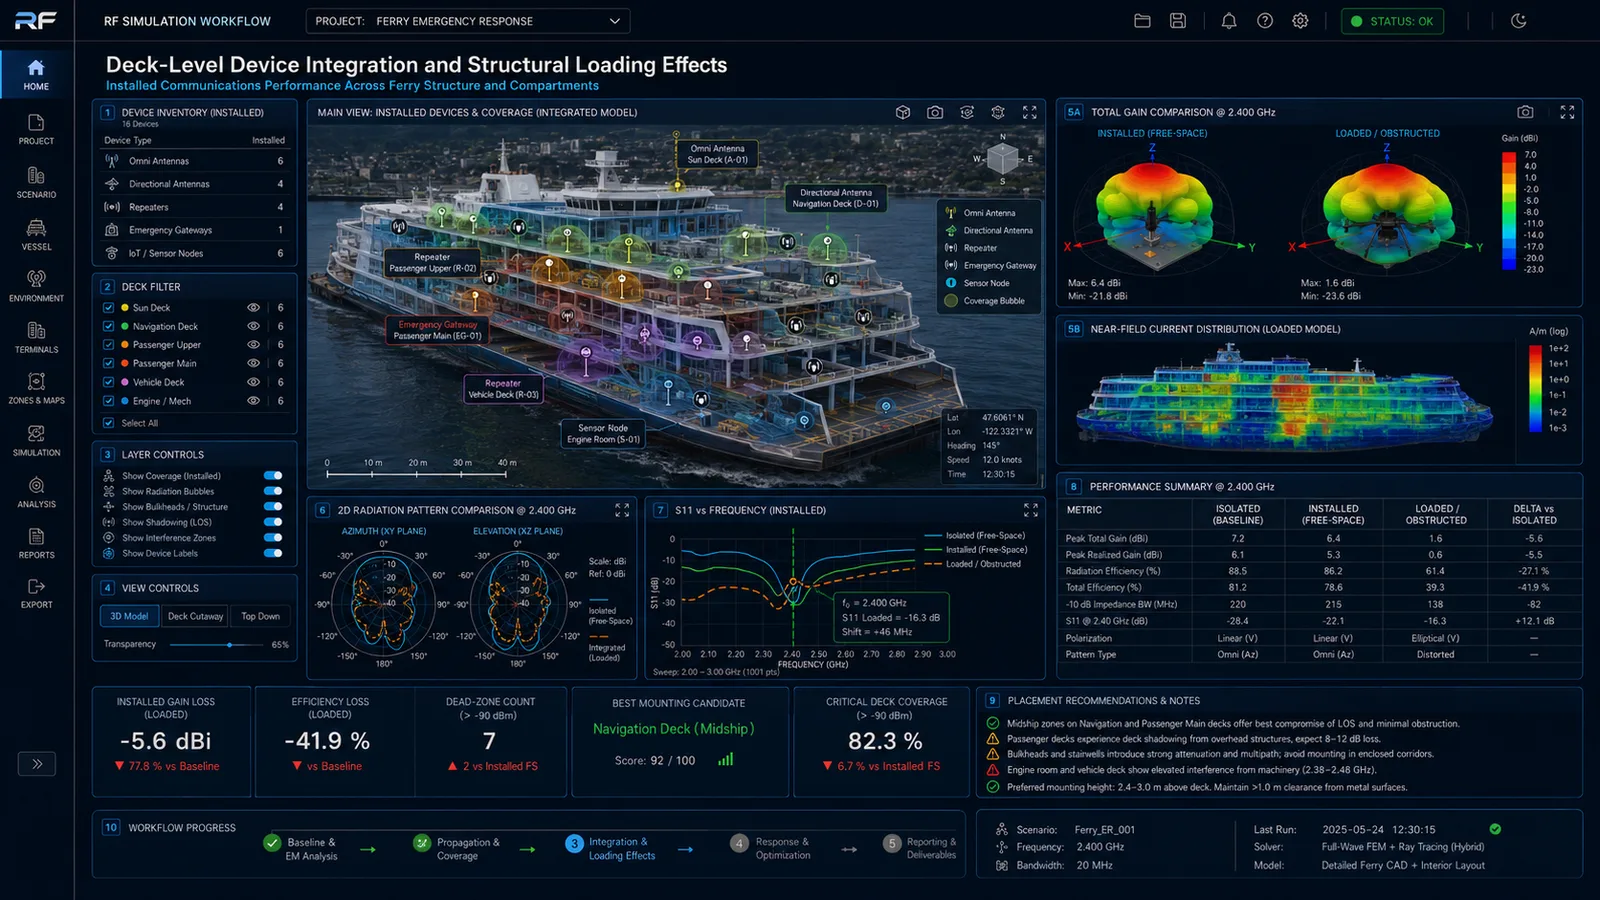
The integration stage evaluates how decks, bulkheads, engine spaces, superstructure, and onboard electronics reshape antenna behavior. Installed-versus-isolated gain, near-field current distribution, efficiency deltas, and placement recommendations are produced against the actual vessel.

Placement decisions that are mechanically convenient may turn out to be RF costly. The model surfaces those tradeoffs before equipment is committed.

Deck-level device integration and structural loading effects
FIG 03Deck-Level Device Integration & Structural Loading · Installed Communications Performance Across Ferry Structure

NoteActual outputs compare isolated, installed, and loaded gain, near-field current distribution, and placement recommendations for the vessel being modeled.

04 /Open-Water and Coastal RF Propagation Analysis
The moving ferry against the route.

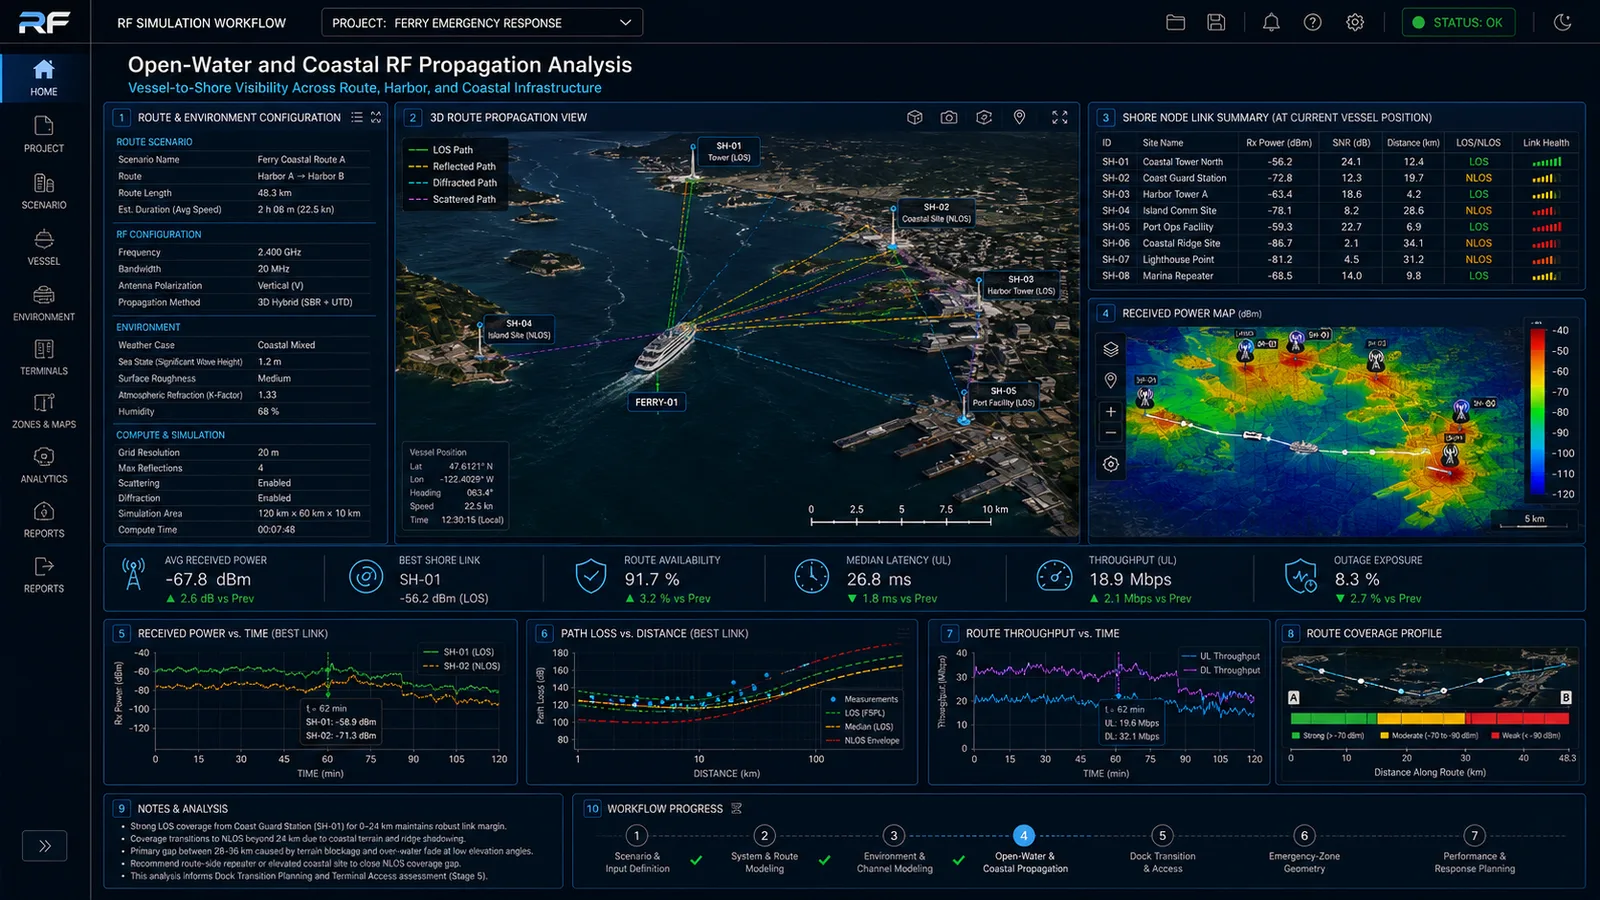
The propagation stage evaluates the RF link between the moving ferry and shore infrastructure across open water, coastal multipath, shoreline reflectors, and weather. Received power maps, path-loss curves, route availability statistics, and shore-node link summaries quantify link reliability across the operating envelope.

This is where static dock-side coverage tests give way to the actual route performance the vessel will experience.

Open-water and coastal RF propagation
FIG 04Open-Water & Coastal RF Propagation · Vessel-to-Shore Visibility Across Route and Coastal Infrastructure

NoteActual outputs show received power maps, path-loss curves, route availability statistics, and shore-node link summaries for the specific route being modeled.

05 /Dock-Transition Connectivity and Shore Handoff Reliability
One of the most operationally complex phases of ferry service.

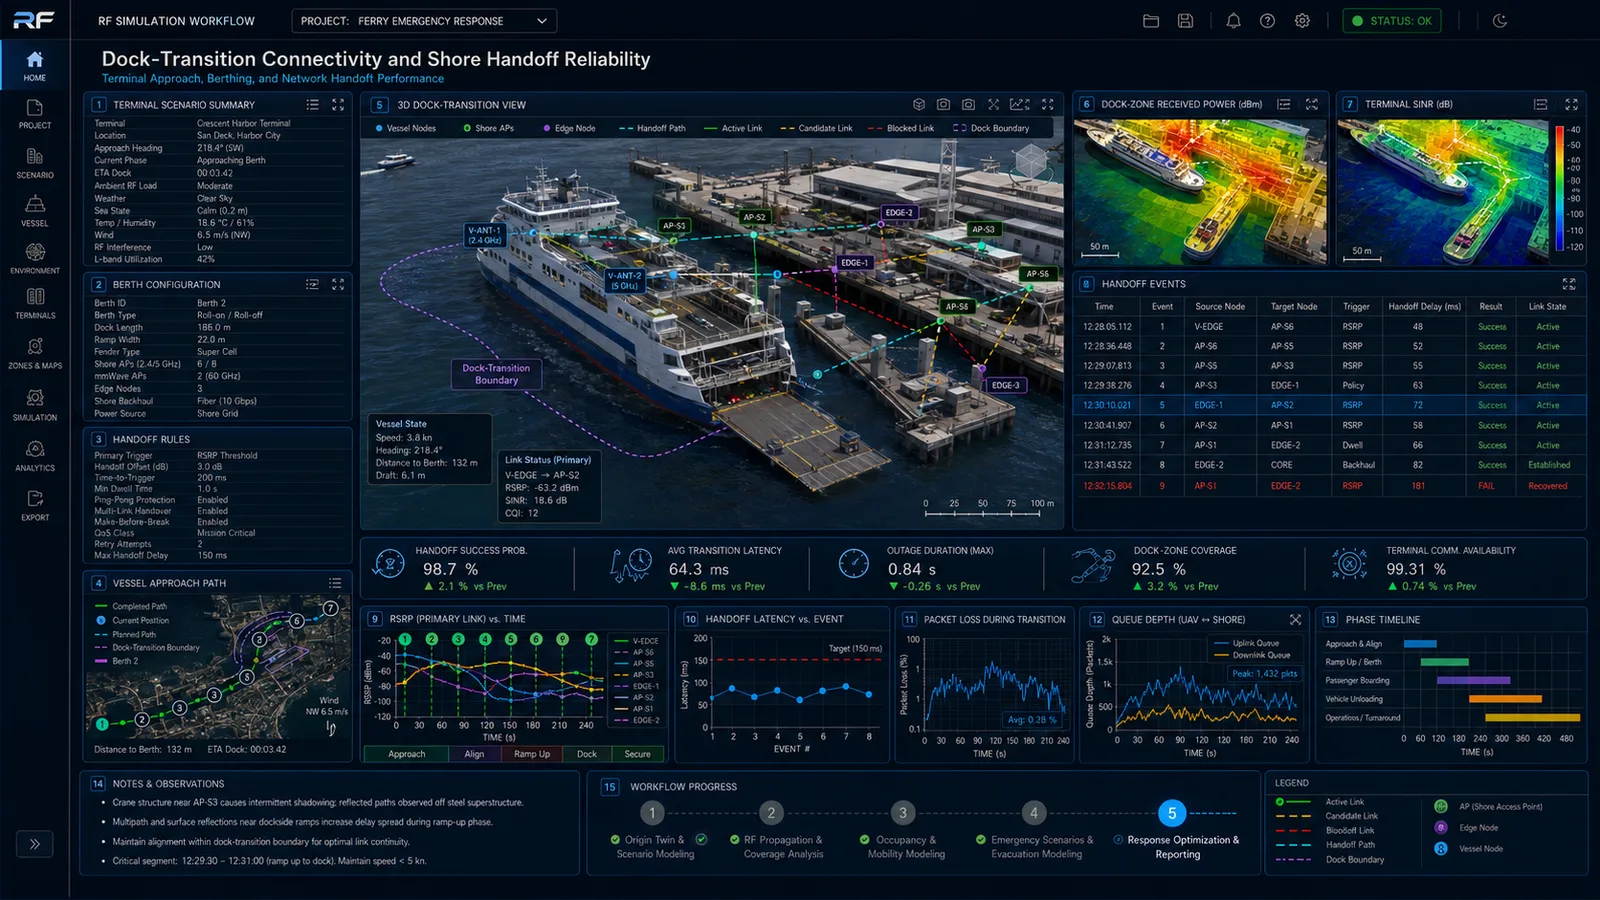
The dock-transition stage evaluates coverage and network handoff during terminal approach, berthing, and departure. Dock-zone received power, SINR, handoff event tables, RSRP time series, and phase timelines characterize behavior during the moments when coverage is most prone to interruption.

Handoff failures during docking are surfaced and resolved in the model rather than during a live emergency at the terminal.

Dock-transition connectivity and shore handoff reliability
FIG 05Dock-Transition Connectivity & Shore Handoff · Terminal Approach · Berthing · Network Handoff Performance

NoteActual outputs show dock-zone received power, SINR, handoff event tables, RSRP time series, and phase timeline for the terminal configuration being modeled.

06 /Dynamic Uplink Emergency Telemetry Propagation
Ferry as transmitter to the shore response network under vessel motion.

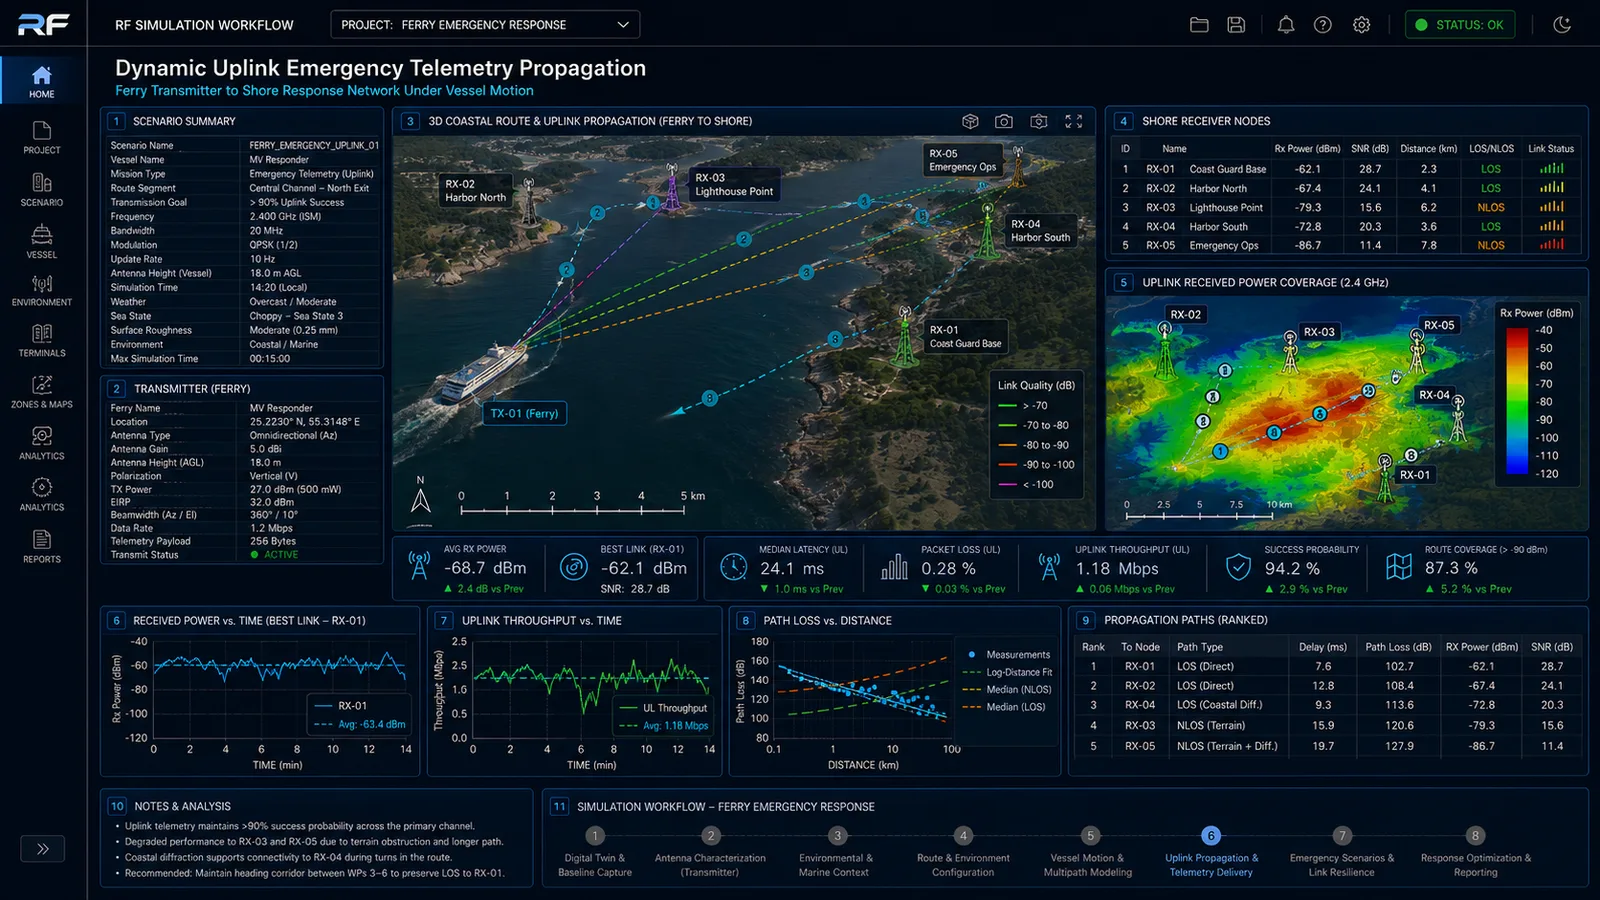
The uplink stage evaluates whether emergency telemetry, position data, video, and command traffic can flow reliably from the moving vessel to shore receivers and response coordination centers. Uplink coverage maps, receiver-node link quality, throughput time series, and propagation path rankings document the uplink envelope across the route.

The result is a quantified picture of what the vessel can reliably send during an incident, not just a coverage circle around the dock.

Dynamic uplink emergency telemetry propagation
FIG 06Dynamic Uplink Emergency Telemetry · Ferry Transmitter to Shore Response Network Under Vessel Motion

NoteActual outputs show uplink coverage maps, receiver-node link quality, throughput time series, and propagation path rankings for the route and infrastructure being modeled.

07 /Dynamic Downlink Coverage to Ferry Systems and Passenger Devices
Shore-to-vessel coverage across the route.

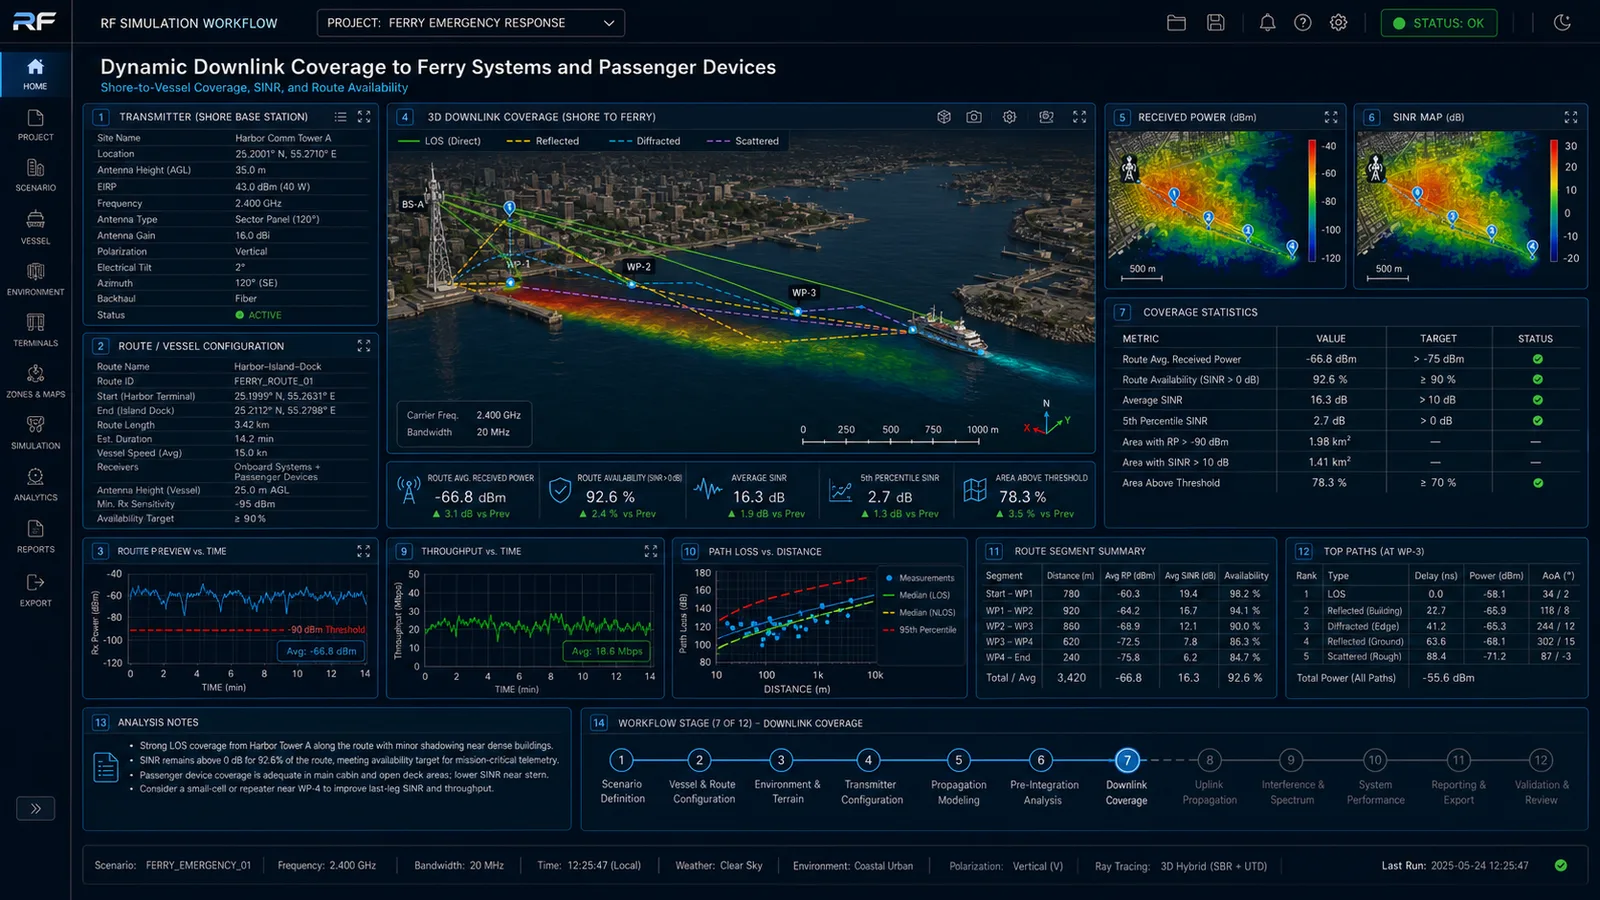
The downlink stage evaluates command traffic, public-safety alerts, and passenger-device coverage from shore infrastructure to the vessel. Downlink coverage statistics, received-power and SINR maps, route-segment summaries, and top-path analysis document coverage across the operating route.

Both uplink and downlink must be answered before the system is committed. Asymmetry between them is identified rather than discovered.

Dynamic downlink coverage to ferry systems and passenger devices
FIG 07Dynamic Downlink Coverage · Shore-to-Vessel Coverage · SINR · Route Availability

NoteActual outputs show downlink coverage statistics, received-power and SINR maps, route segment summaries, and top-path analysis for the shore infrastructure being modeled.

08 /Passenger Occupancy, Evacuation, and Emergency Access Simulation
Extends the simulation past the radios into people and procedures.

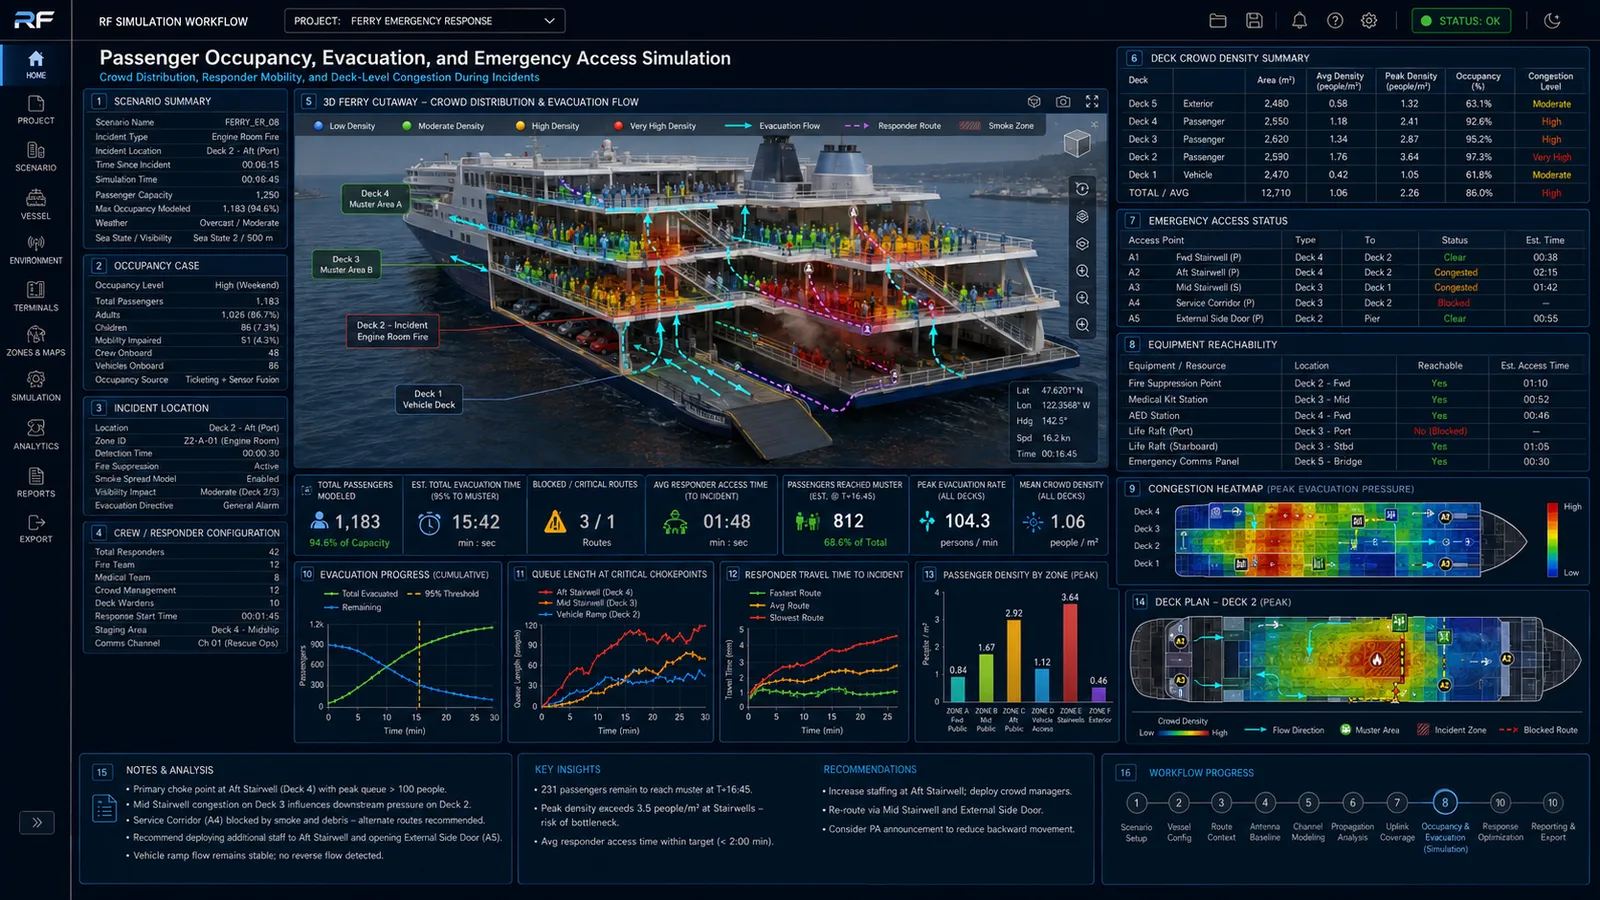
This stage models passenger crowd distribution, responder mobility, deck-level congestion, and emergency-access flow. 3D crowd-density overlays, evacuation progress curves, queue lengths at chokepoints, and responder travel times quantify how the integrated system performs under realistic occupancy and incident scenarios.

The communications chain is only useful if the people and procedures it supports can actually act on it. This stage closes that loop.

Passenger occupancy, evacuation, and emergency access simulation
FIG 08Passenger Occupancy & Evacuation · Crowd Distribution · Responder Mobility · Deck-Level Congestion

NoteActual outputs show 3D crowd-density overlays, evacuation progress curves, queue length at chokepoints, and responder travel time for the passenger manifest and vessel configuration being modeled.

09 /Operational Readiness, Failure Modes, and Telemetry Calibration
Resilience assessment and model refinement from live data.

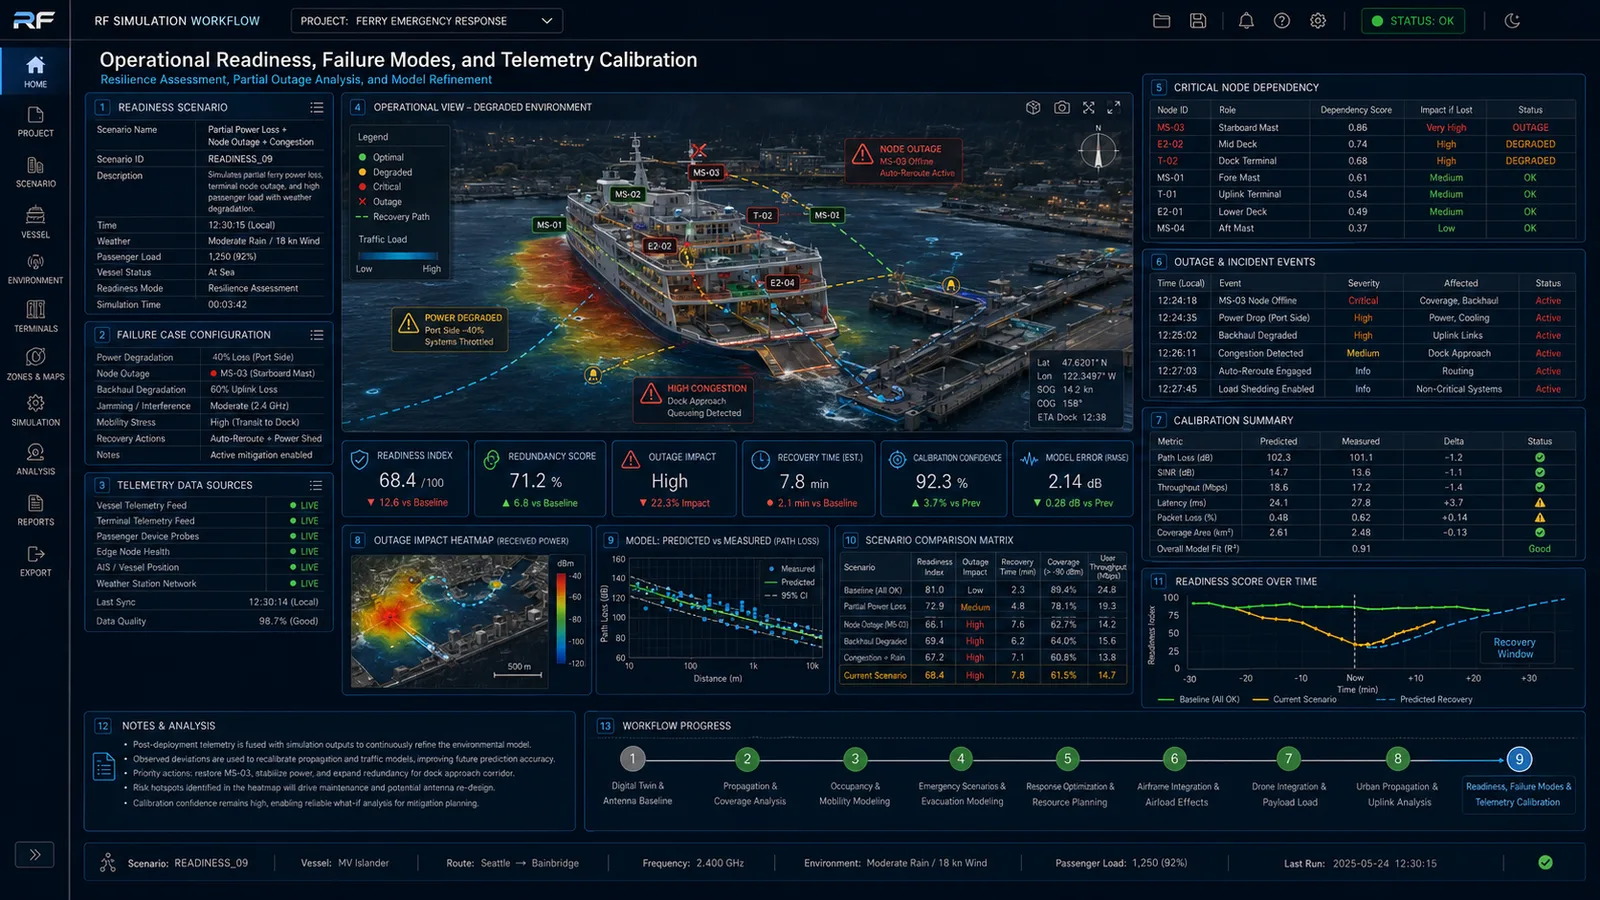
The readiness stage evaluates how the integrated system performs under partial outages, equipment failures, sea state and weather extremes, and combinations of degradations. Degraded operational views, critical node dependency tables, outage heatmaps, predicted-versus-measured calibration, and readiness scores over time quantify resilience and identify where the system depends on a single point.

Each operating season feeds telemetry back into the model, so the simulation grows more accurate with each deployment.

Operational readiness, failure modes, and telemetry calibration
FIG 09Operational Readiness & Failure Modes · Resilience Assessment · Partial Outage Analysis · Model Refinement

NoteActual outputs show degraded operational views, critical node dependency tables, outage heatmaps, predicted vs. measured calibration, and readiness score over time for the deployment being modeled.

Reliability you can defend

The simulation stages feed a small set of consequential decisions. The outcomes below are what a fleet operator carries into commissioning, into classification review, and into revenue service.

01 /Communications Reliability Under the Operating Envelope
Test the system across the route, not just on the dock.

RF performance across loaded versus unloaded vessels, dock-transition handoffs, shore-network coverage along the route, and weather windows is modeled before commissioning rather than discovered after an incident. Antenna positions, gateway configurations, and route corridors are validated against the actual operating environment. The result is a communications system whose behavior under load is understood before the first revenue run.

02 /Regulatory and Classification Posture
USCG, IMO, and class-society reviews want documented evidence.

Marine safety regulators and classification societies increasingly expect documented analysis of communications and emergency-response systems, not just bench-tested components. Simulation outputs are that evidence: coverage maps under operating conditions, link-margin envelopes, and response-time predictions for emergency scenarios. Submitting a deployment with this documentation shortens review cycles and reduces the conditions attached to operating approvals.

03 /Schedule Reliability
Fewer pulled runs, more revenue days per quarter.

Scheduled-service operators lose revenue every time a vessel is pulled from service for an unplanned communications repair. Simulation reduces the incidence of failures that drive unplanned downtime by identifying marginal links and unstable handoffs before they manifest in service. Over the life of a vessel, the cumulative effect is fewer pulled runs, fewer cascading schedule disruptions across the fleet, and a more predictable revenue line.

04 /Insurance and Incident Defense
Predictable, documented behavior changes the conversation.

Insurance underwriters and incident investigators respond to documented system behavior. A vessel whose communications architecture was modeled before installation, validated in commissioning, and tracked against the model in service is in a different position than one whose behavior is tribal knowledge. The same documentation supports premium negotiations, claims defense, and the inquiries that follow any incident with passenger or crew involvement.

Where simulation does not solve the problem alone

Simulation does not replace crew judgment, extreme weather protocol, or live spectrum surveys. The boundaries below are explicit so the deliverable is read accurately.

01 /Emergency Response Has a Human Component
Crew judgment and passenger behavior are outside the model.

The simulation models communications coverage, evacuation geometry, and equipment redundancy. Crew decisions during an actual emergency, passenger compliance with safety procedures, and the human dynamics that shape outcomes in real incidents are not represented. Simulation supports planning and drills; live incident response depends on training, command structure, and the conditions on the day.

02 /Sea State and Weather Have Bounded Coverage
The model addresses the conditions it is given, not every storm.

Performance under representative weather, sea state, and route conditions is modeled. Extreme storms, atypical sea states, sustained adverse weather, and combinations of degradations that fall outside the input scenario set are not predicted. Operational protocols for cancelling or diverting service remain the way to address conditions the simulation envelope does not cover.

03 /Unknown Interference Sources Are Out of Scope
The model accounts for known emitters, not unidentified ones.

Interference simulation is bounded by what is known. The model can include planned shore-network infrastructure, documented incumbent emitters along the route, and previously observed interference at terminals. It cannot foresee unknown interferers, transient emitters from passing vessels, or new RF sources installed on shore. Periodic spectrum surveys and post-deployment telemetry are the way to identify them, after which they can be incorporated into subsequent simulation runs.

Integrating Simulation into Ferry IoT Deployments

Simulation is integrated at the deployment planning layer, before onboard antenna and gateway equipment is committed or emergency coverage is reported to classification authorities. Each engagement begins with a scoping call to define the operating envelope: vessel class, deck-level device inventory, emergency-zone geometry, route and dock infrastructure, sea state and weather envelope, passenger occupancy patterns, and the classification framework the deliverable must satisfy.

Ferry geometry, onboard antenna configurations, and the open-water and coastal RF environment are then captured as a working model, and the simulation stages run against the actual operational and emergency cases the ferry expects to face. Deliverables include the ferry digital twin and emergency-zone geometry, onboard antenna and emergency gateway characterization, deck-level device integration analysis, open-water and coastal RF propagation predictions, dock-transition connectivity and shore handoff reliability, emergency telemetry propagation maps, passenger occupancy and evacuation simulation, operational readiness and failure-mode analysis, and a written brief that documents the analysis for vessel operators, classification societies, and insurance underwriters.

As the fleet operates across seasons and routes, the planning record grows. Post-deployment telemetry from connectivity, occupancy, and emergency drill events informs the next round of planning, and the simulation library becomes an internal asset that the operator carries from one vessel to the next.

Planning a Maritime IoT or Emergency-Response Deployment?

For passenger ferries, harbor craft, and coastal emergency-response operators, we bring layered simulation across vessel structure, route, dock, and human-response dynamics, so communications and emergency capability are validated against the conditions of the day.