Commercial Construction Simulation

Construction Site Planning

A planning engagement for commercial construction projects. Simulation is one stage of the workflow, used to build a phased digital twin of the site, place temporary infrastructure against an evolving structure, surface trade conflicts before mobilization, and forecast how schedule and logistics decisions propagate through the project.

A layered operational decision environment

Construction projects are dynamic operating environments. The site changes physically, logistically, electrically, structurally, and operationally from week to week. A communication layout, camera plan, equipment route, or staging strategy that works in one phase may become ineffective once steel is erected, concrete cores are poured, temporary barriers are added, or multiple trades begin working in the same zone.

The concept of simulation for a commercial construction site is to build a layered digital environment that moves from physical geometry to infrastructure performance, field operations, coordination, and schedule consequence. The simulation is not just a 3D model of a building. It is an operational decision environment that helps project teams understand how site layout, temporary infrastructure, workforce movement, material flow, and construction sequencing interact before those interactions become field problems.
Each layer depends on the one before it

A site model without infrastructure analysis shows where things are, but not whether systems can operate. Infrastructure placement without RF modeling shows where devices are installed, but not whether they will connect reliably. RF modeling without site evolution may work for one phase, but fail when the structure changes.

The same kind of gap appears once the site is operating. Field movement without connectivity modeling may miss why crews lose access to digital tools, cameras, or communication systems in certain zones. Schedule forecasting without operations simulation may miss the physical causes of delays. Telemetry without a model may show that something went wrong, but not explain why or predict where it will happen next.

The simulation workflow is designed to expose the interactions between layers, because those interactions are where most construction risk actually lives.

Nine stages. Each one answering a different question.

The simulation moves from physical geometry to schedule consequence. Each stage below produces a specific artifact and answers a specific operational question. Figures shown are representative. Actual outputs are produced against the specific site, phase plan, and operating environment being modeled.

01 /Site Geometry and Phased Construction Digital Twin
The site as it actually exists and evolves through each phase.

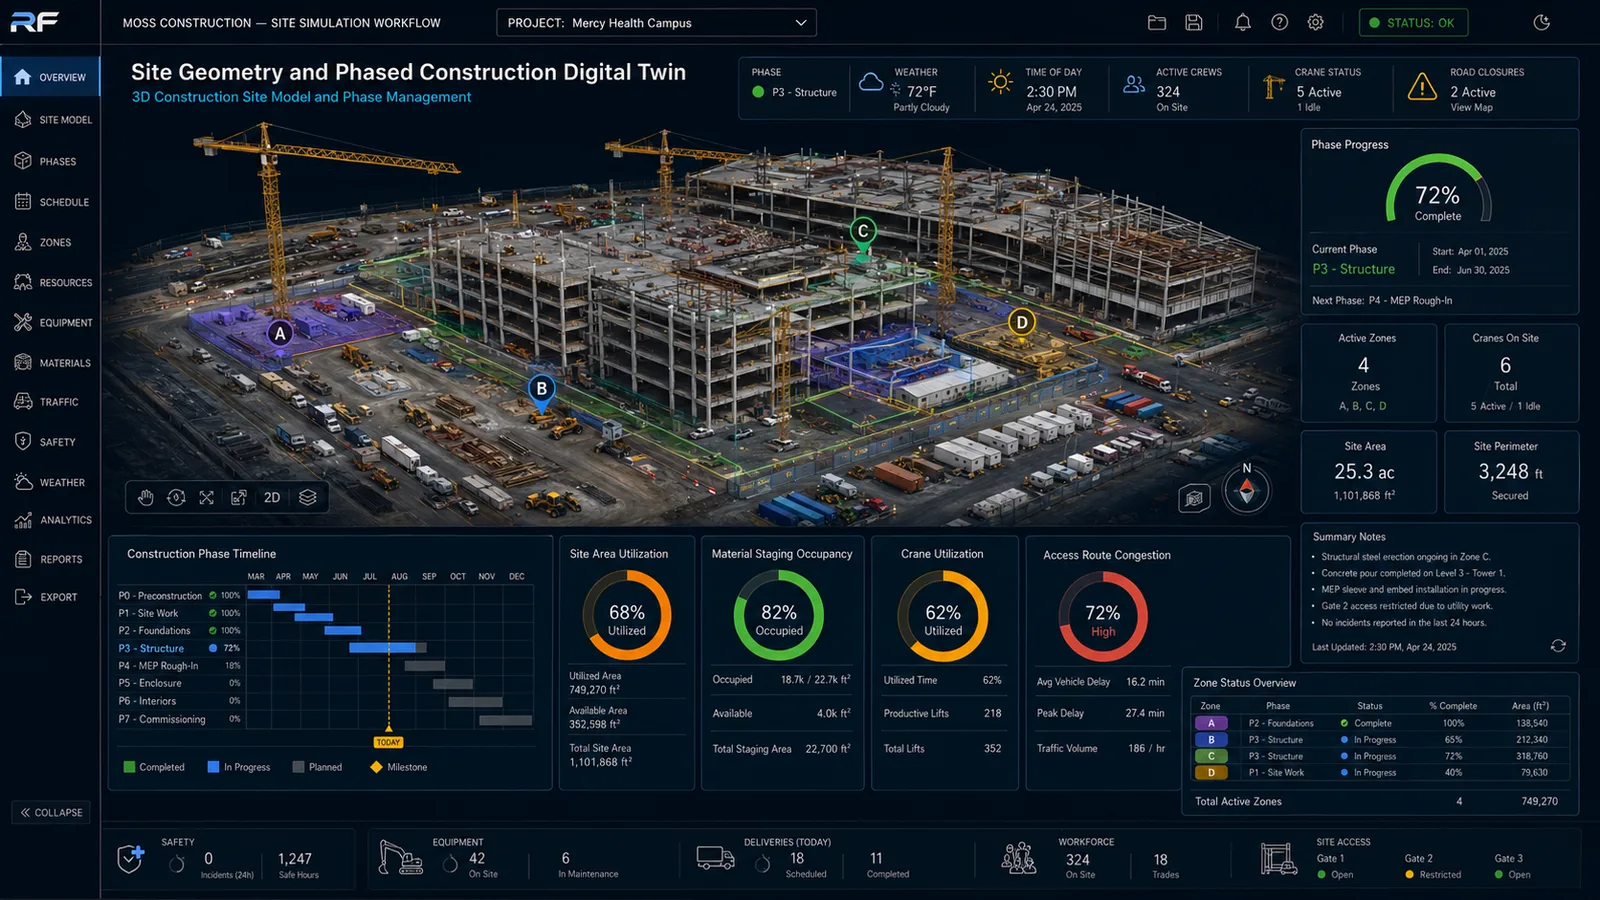
The simulation begins with the construction-site digital twin. This establishes the baseline geometry of buildings, cranes, trailers, roads, laydown yards, vertical cores, temporary barriers, and active work zones across all construction phases. Wireless coverage, camera visibility, crane reach, access-control performance, and material movement all depend on accurate site geometry at every phase.

This stage validates the physical truth model. It provides the 3D site model, phase timeline, active-zone overlays, crane utilization, staging occupancy, and access-route congestion views that anchor every subsequent simulation.

Site geometry and phased construction digital twin
FIG 01Site Geometry & Phased Digital Twin · 3D Site Model · Phase Management · Zone Tracking

NoteActual outputs reflect the specific site geometry, phase schedule, crane configuration, and zone boundaries as modeled from project documentation and field data.

02 /Temporary Network and Field Infrastructure Placement
Where to put temporary networks before the field has to retrofit them.

Construction sites depend on temporary networks, field-office connectivity, access-control readers, cameras, radios, sensors, and jobsite trailers. These systems are frequently installed under schedule pressure and adjusted reactively when problems emerge.

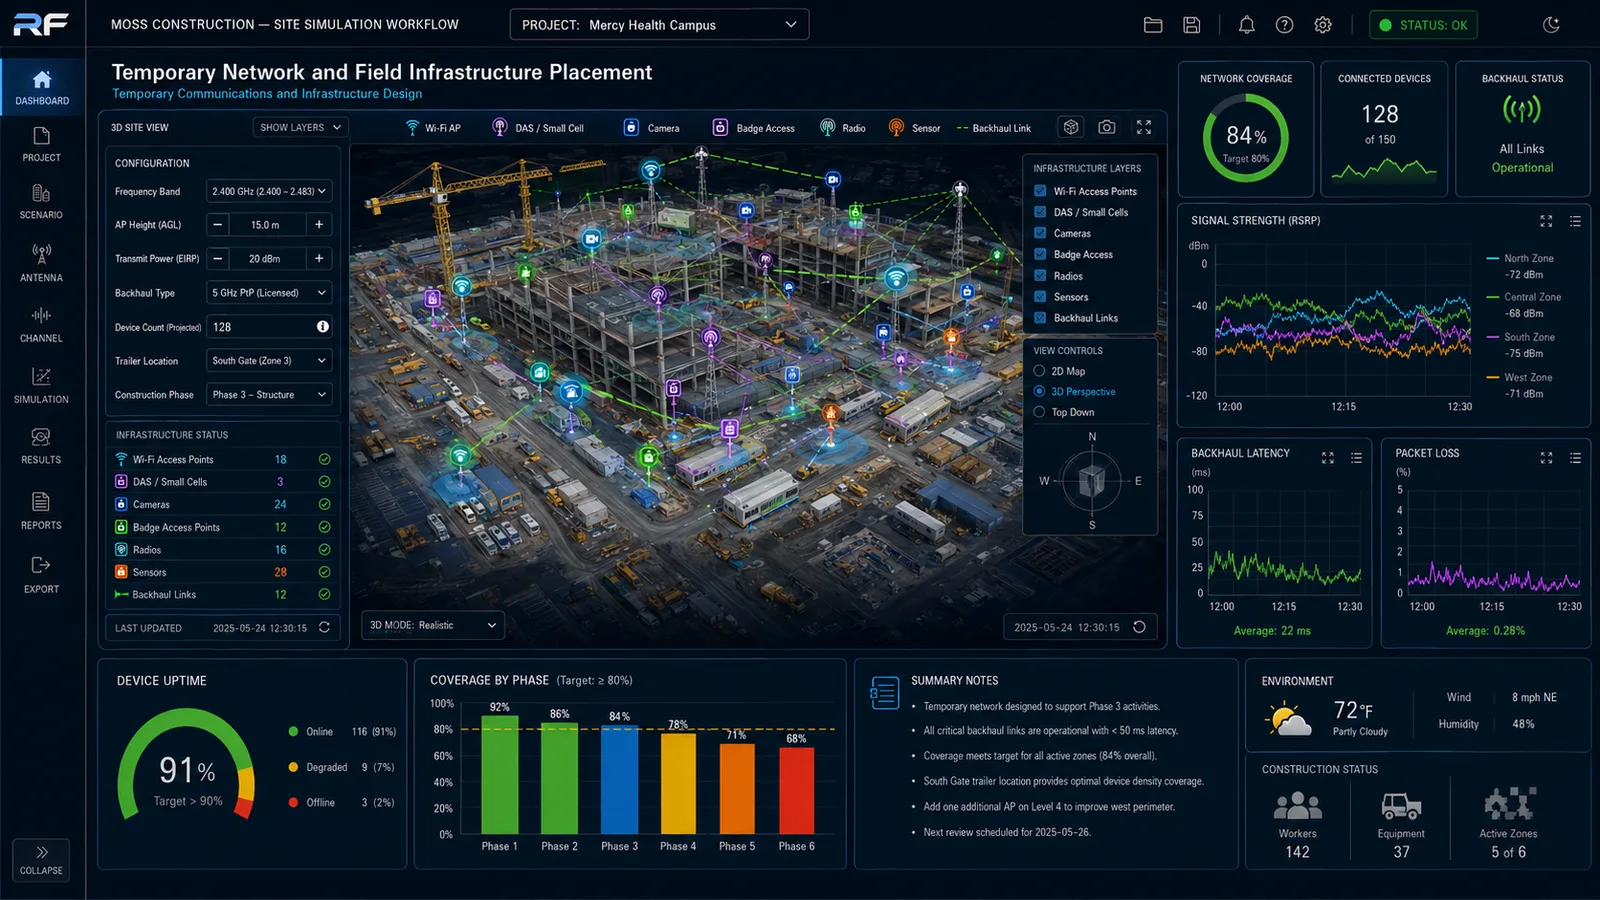
The simulation models placement of Wi-Fi, temporary DAS and small cells, cameras, badge access, radios, sensors, trailers, and backhaul links against the actual site geometry before installation begins. Decisions made here, when infrastructure is still configurable, are far less costly than repositioning equipment after crews have lost digital access.

Temporary network and field infrastructure placement
FIG 02Temporary Network & Field Infrastructure · Wi-Fi, DAS, Cameras, Badge Access, Sensors · Coverage by Phase

NoteActual outputs show infrastructure coverage, backhaul link quality, device uptime, and phase-by-phase connectivity performance calibrated to the site configuration and frequency plan.

03 /Crane, Trailer, Camera, and Access-Control Coverage
Camera and perimeter coverage validated against the active site, not the as-planned drawing.

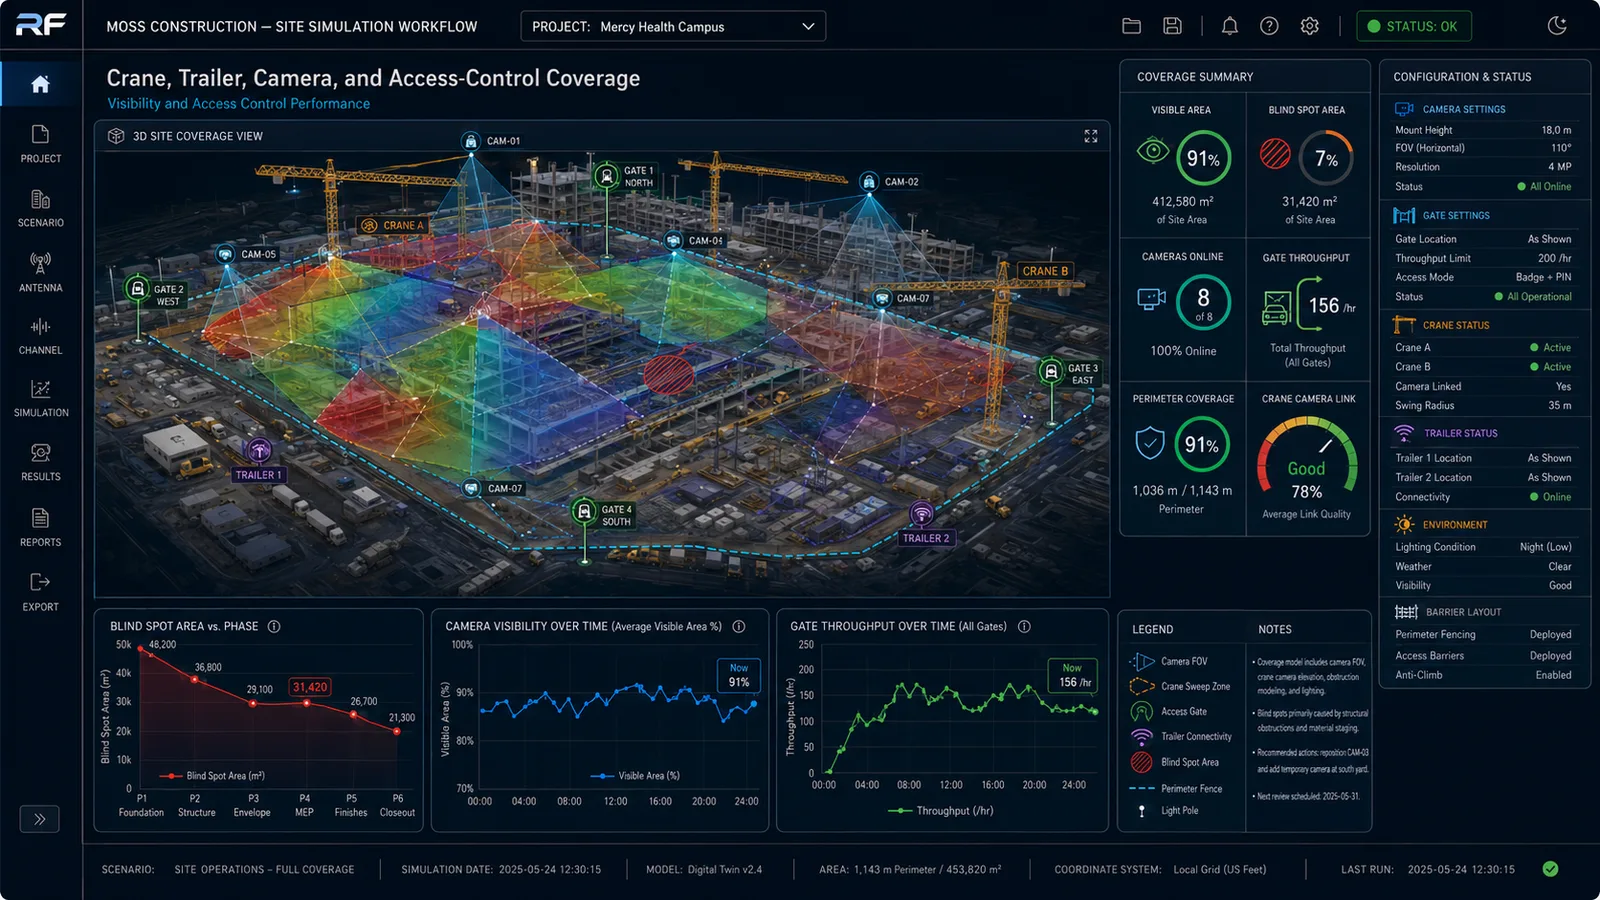
Camera visibility, crane-mounted camera links, access gates, trailer connectivity, perimeter coverage, and blind spots are evaluated against the evolving site geometry. Camera FOV cones, crane swing zones, gate throughput, perimeter coverage statistics, and blind-spot area are tracked as the site configuration changes.

The simulation shows how blind spots grow and shrink as structural work, staging changes, and phase boundaries alter sightlines. This identifies security, safety, and access-control gaps before site configuration changes obscure critical areas.

Crane, trailer, camera, and access-control coverage
FIG 03Crane, Trailer, Camera & Access-Control Coverage · Camera FOV · Crane Swing Zones · Gate Throughput · Perimeter Coverage

NoteActual outputs model camera visibility, crane-mounted camera links, gate throughput, and perimeter coverage for the specific site layout, camera placement, and construction phase being modeled.

04 /Dynamic RF and Connectivity Propagation
Connectivity that holds as steel rises and the structure changes.

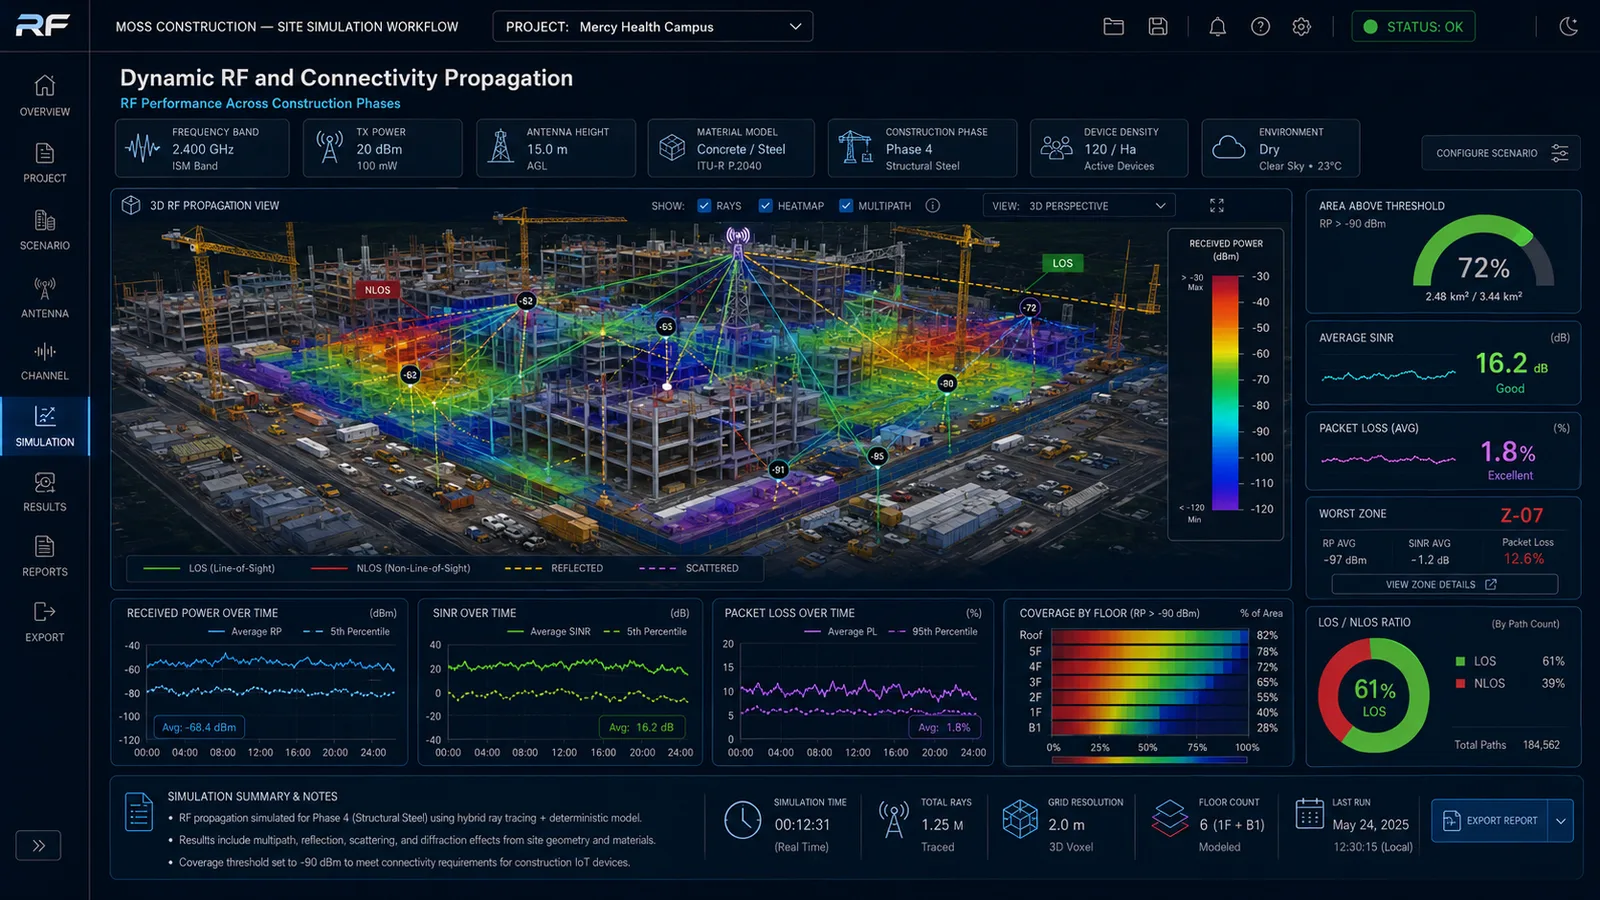
RF propagation is modeled against the site as it actually evolves. Wi-Fi, cellular, walkie-talkie, sensor, and IoT links are evaluated against the structure, materials, and active zones of each construction phase. Received power, SINR, line-of-sight ratio, packet loss, and indoor-versus-outdoor coverage are tracked across phases.

Connectivity failure modes that would normally appear after structural completion are surfaced in advance. Crews keep digital tools, documents, and communications through every phase.

Dynamic RF and connectivity propagation
FIG 04Dynamic RF & Connectivity Propagation · RF Performance Across Construction Phases · Ray Tracing · Coverage by Floor

NoteActual outputs show received power, SINR, LOS/NLOS ratio, and packet loss calibrated to the site geometry, construction phase, AP placement, and frequency plan.

05 /Workforce, Equipment, and Material Flow Simulation
Crew, equipment, and material flow modeled before the gate becomes a queue.

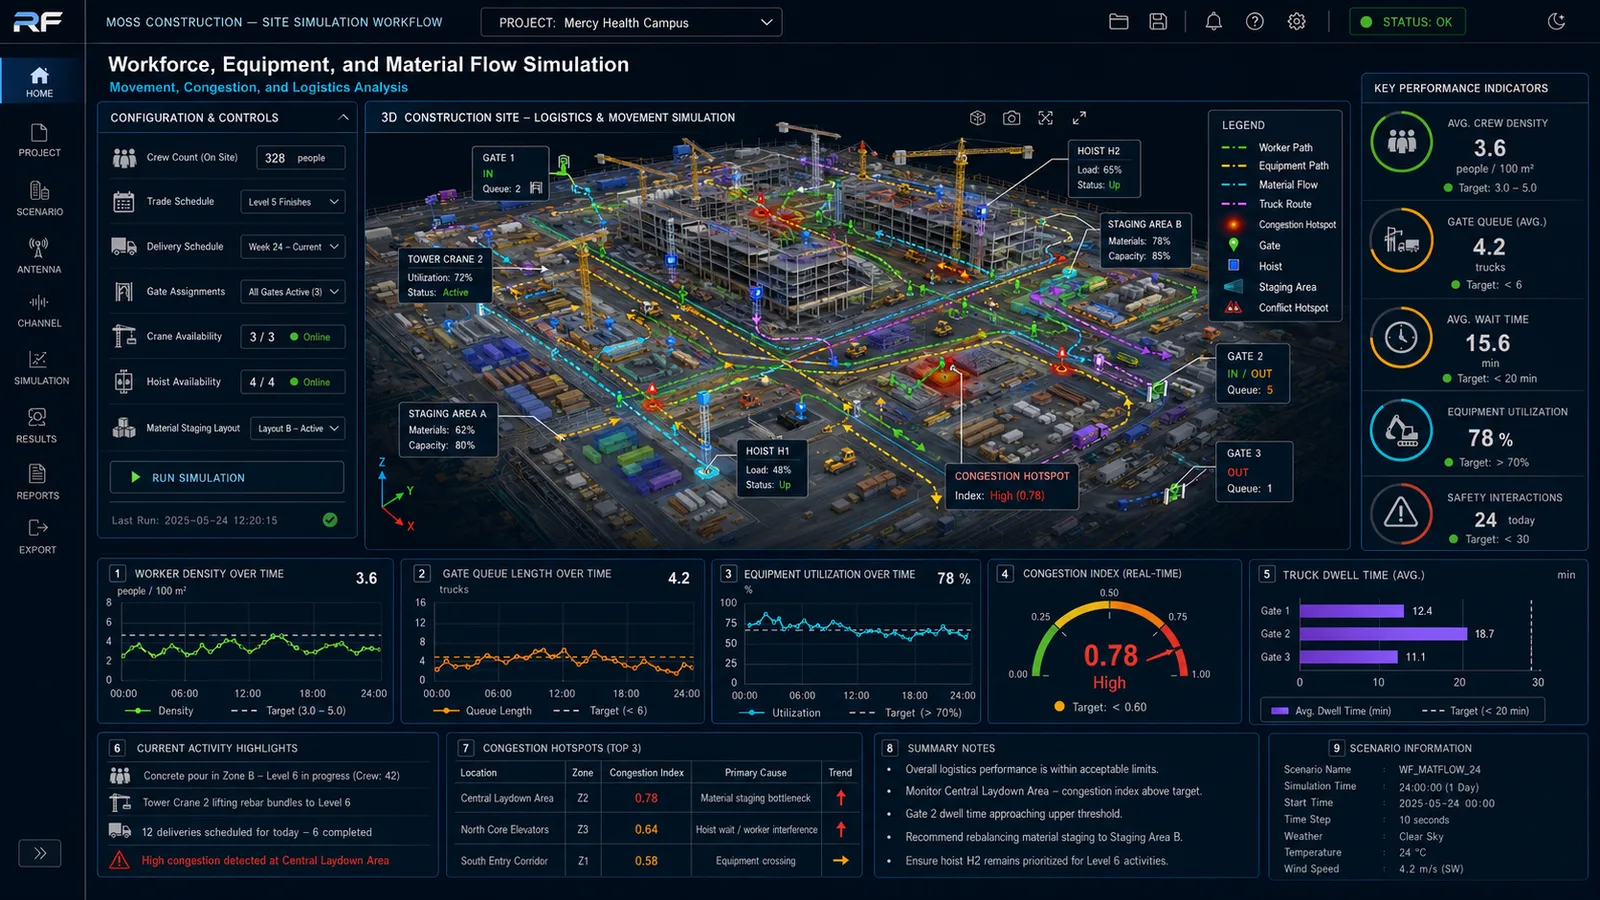
Worker movement, equipment paths, gate throughput, crane utilization, material delivery sequencing, and crew density are modeled against the site layout. Congestion hotspots, equipment idle time, and crew-equipment conflicts are identified before mobilization.

Decisions about gate placement, delivery scheduling, equipment routing, and crew staging are evaluated against the actual site, not against the planned final state. The phase plan reflects how the site will actually flow.

Workforce, equipment, and material flow simulation
FIG 05Workforce, Equipment & Material Flow · Crew Density · Gate Queues · Equipment Utilization · Congestion Hotspots

NoteActual outputs model worker movement, equipment paths, gate throughput, crane utilization, and congestion indices calibrated to the crew counts, delivery schedule, and site layout.

06 /Vertical Core, Elevator, and Enclosure Coverage
Signal reliability inside the cores, stairwells, and shafts where service degrades.

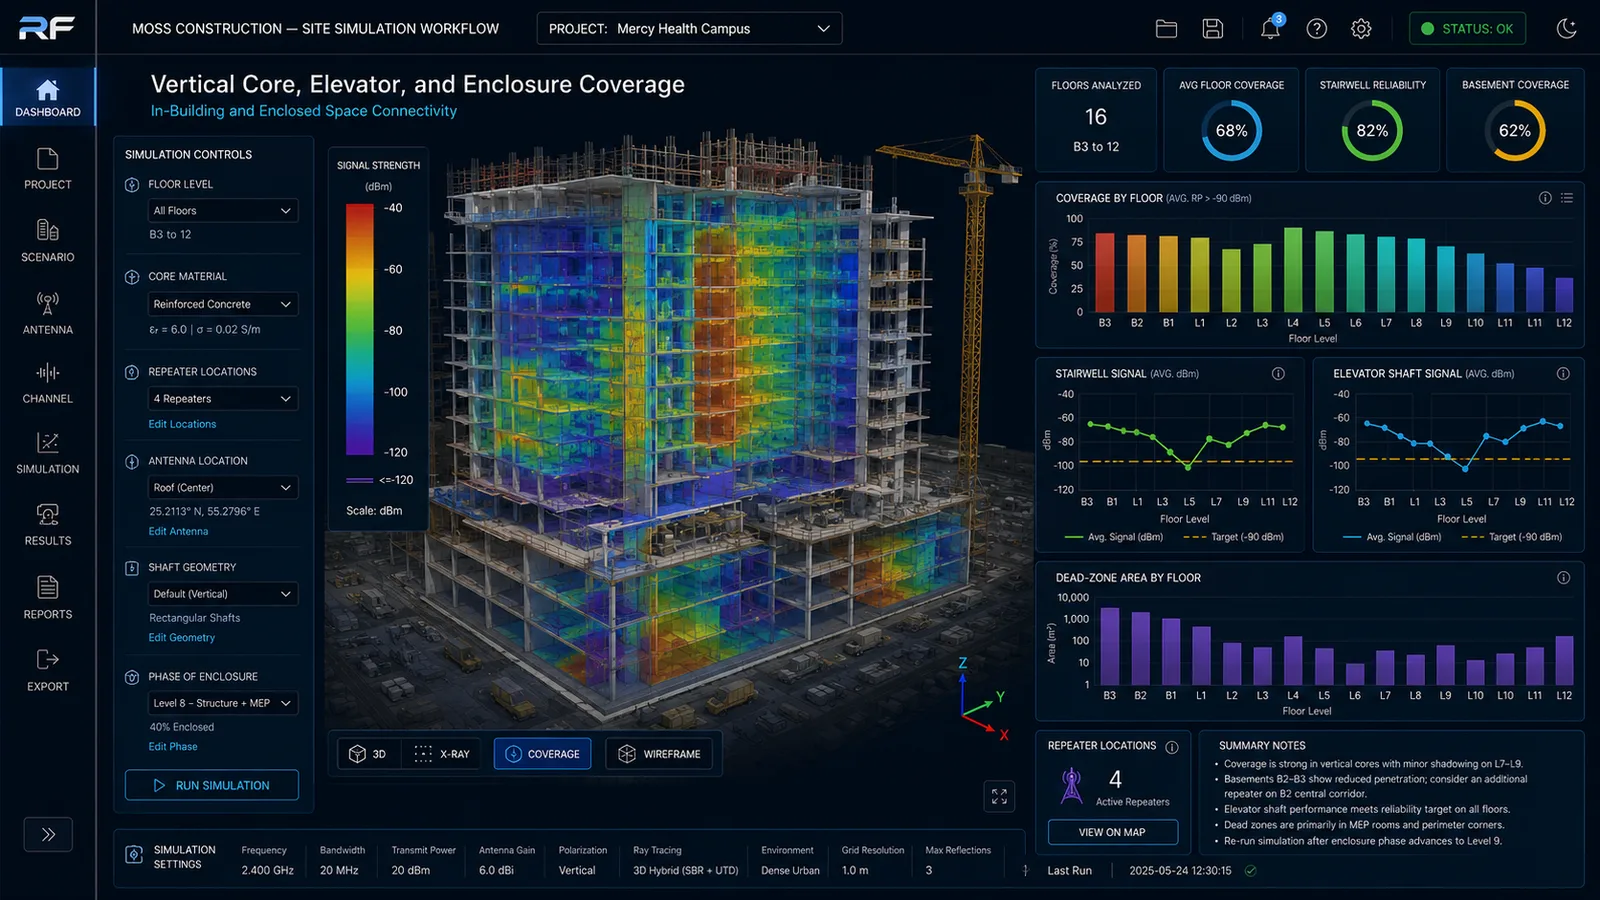
Vertical cores, elevator shafts, stairwells, and enclosed spaces are evaluated for signal strength, dead-zone area, repeater coverage, and floor-by-floor reliability. The simulation accounts for core material, floor plate geometry, structural reinforcement, and the progression of enclosure during construction.

Floor-by-floor connectivity, stairwell reliability, elevator shaft coverage, and dead-zone area are identified before commissioning. Repeater placement and antenna selection are decided against the actual building, not against a generic floor plan.

Vertical core, elevator, and enclosure coverage
FIG 06Vertical Core, Elevator & Enclosure Coverage · Floor-by-Floor Signal · Stairwell and Shaft Performance · Dead-Zone Area

NoteActual outputs show signal strength by floor, stairwell reliability, elevator shaft coverage, and dead-zone area calibrated to the building geometry, core material, and repeater placement.

07 /Multi-Team Coordination and Trade-Conflict Simulation
Surface trade conflicts in the model, before the field absorbs them as rework.

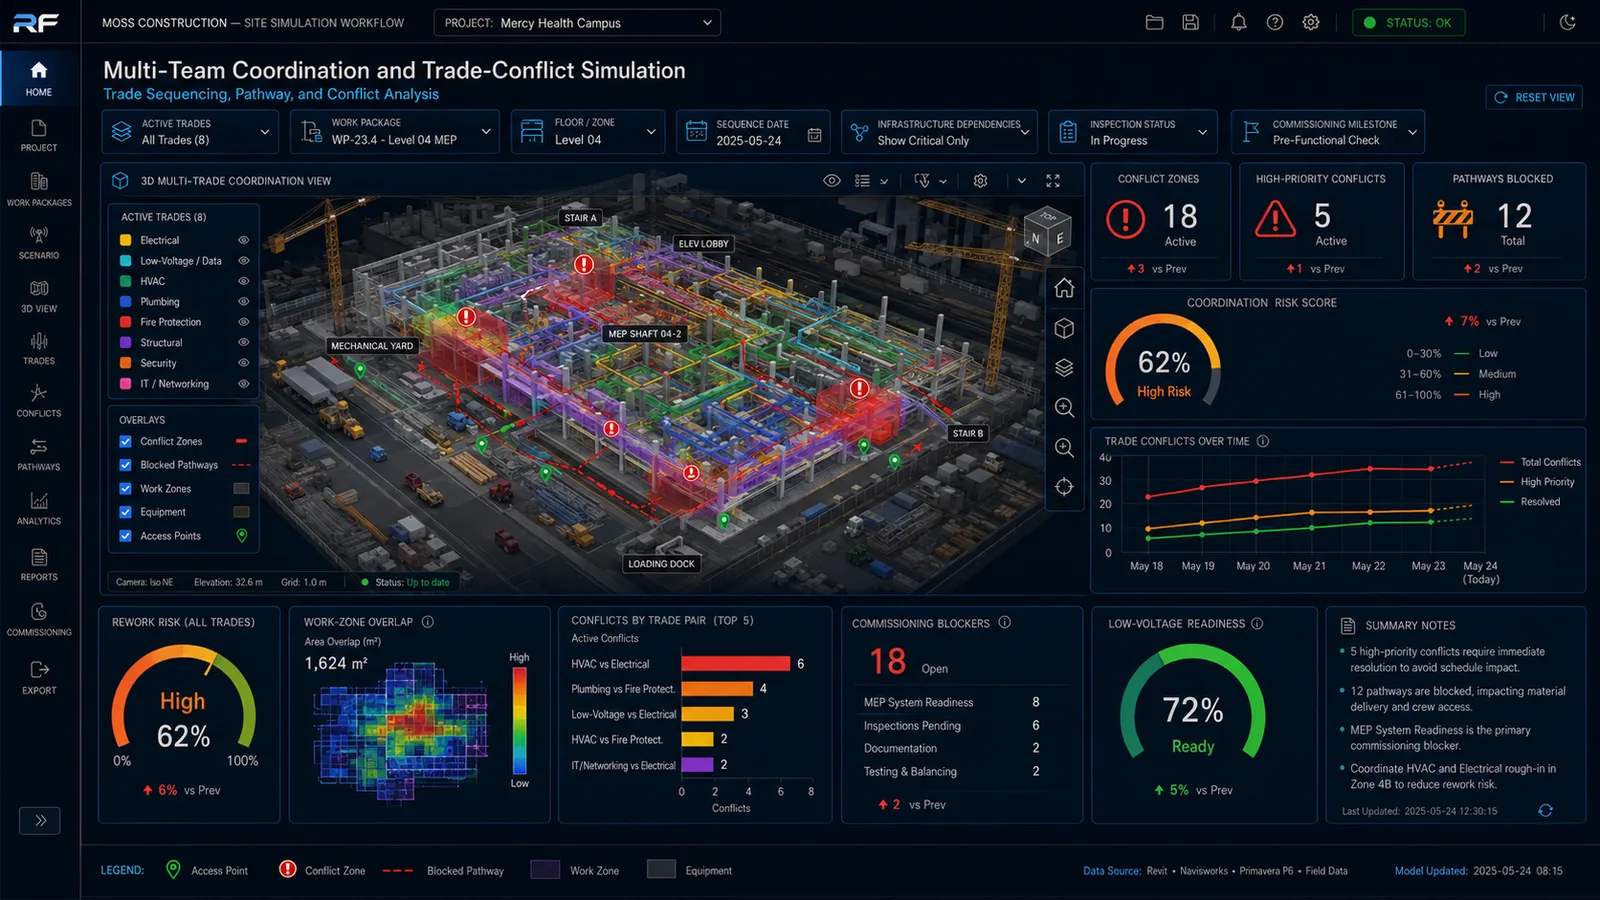
Trade overlays, work-package sequencing, conflict zones, blocked pathways, and commissioning readiness are evaluated against the site digital twin and project schedule. Conflicts between mechanical, electrical, structural, and finish trades are surfaced in the model rather than discovered on the slab.

Time lost to trade standby, equipment idle, and rework from clash-driven mistakes is recovered. The schedule the project plans around becomes one the field can actually hold.

Multi-team coordination and trade-conflict simulation
FIG 07Multi-Team Coordination & Trade-Conflict Simulation · Trade Overlays · Conflict Zones · Blocked Pathways · Commissioning Readiness

NoteActual outputs reflect the specific trade schedule, BIM model, work package sequencing, and coordination constraints from Revit, Navisworks, Primavera, and field data.

08 /Schedule, Logistics, and Operational Impact Forecasting
Translate field disruption into schedule and cost consequence.

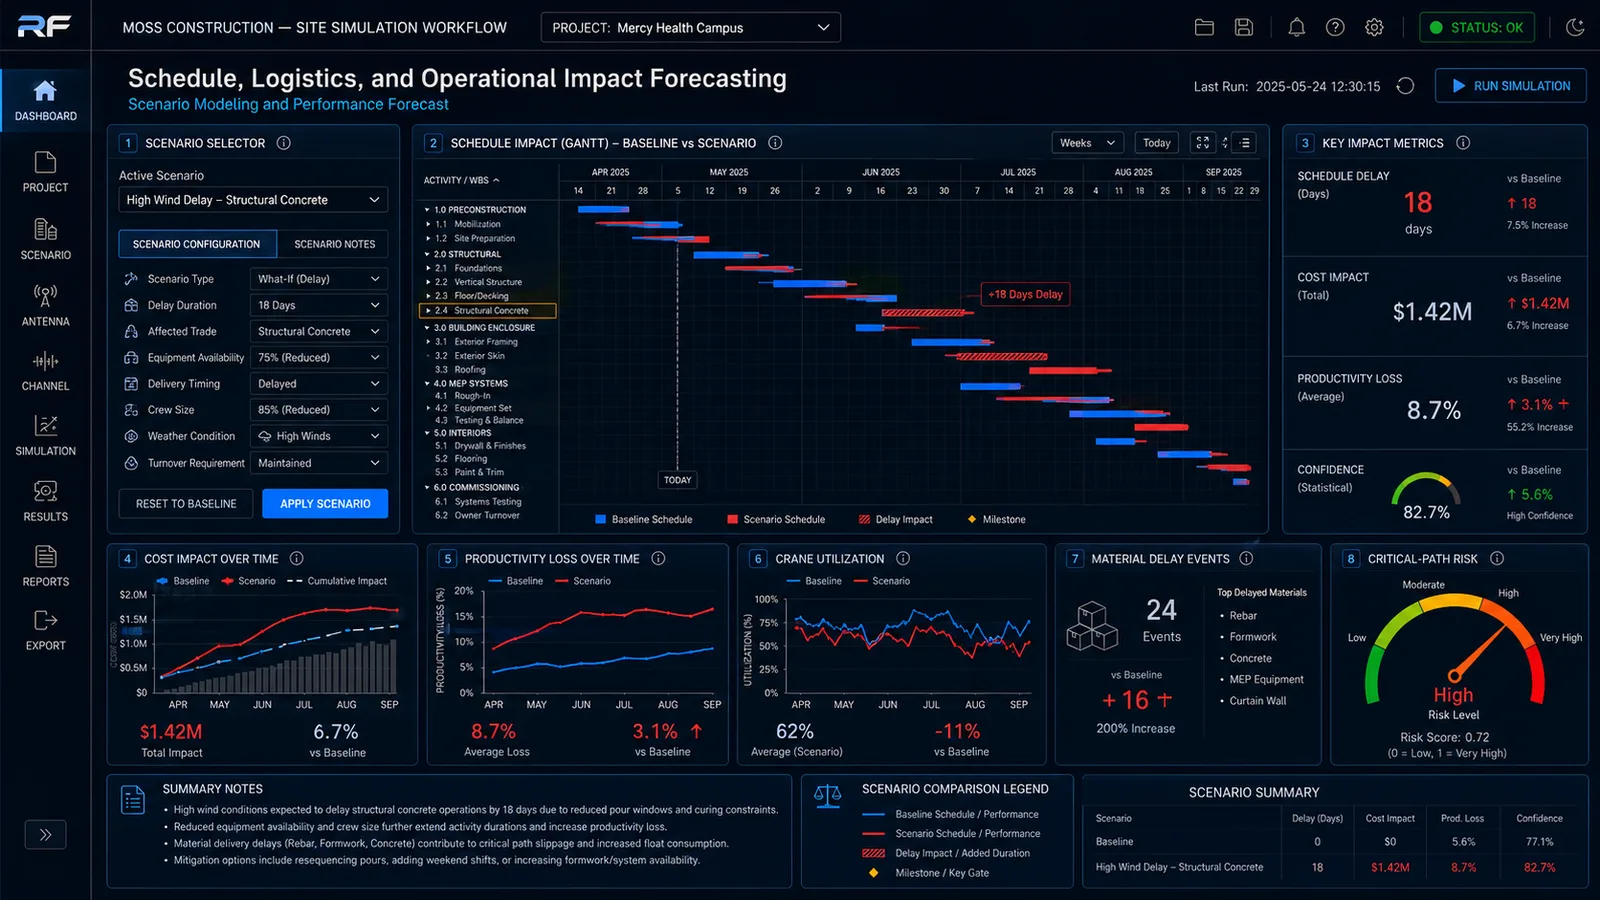
Schedule scenarios are evaluated against baseline plans. Delay propagation, critical-path risk, cost impact, and operational consequences are forecast for trade delays, equipment unavailability, weather windows, and material slippage. The simulation produces baseline-versus-scenario Gantt overlays and quantified impact summaries.

Mitigation decisions are made against the full project, not the local task. Owner and architect conversations are anchored on shared modeled outcomes rather than separate mental models.

Schedule, logistics, and operational impact forecasting
FIG 08Schedule, Logistics & Operational Impact Forecasting · Baseline vs. Scenario Gantt · Cost Impact · Critical-Path Risk

NoteActual outputs model schedule consequences from the specific delay scenarios, trade configurations, equipment availability, and project baseline using the Primavera or project schedule data provided.

09 /Telemetry Feedback and Model Calibration
Close the loop between predicted behavior and what the site actually measures.

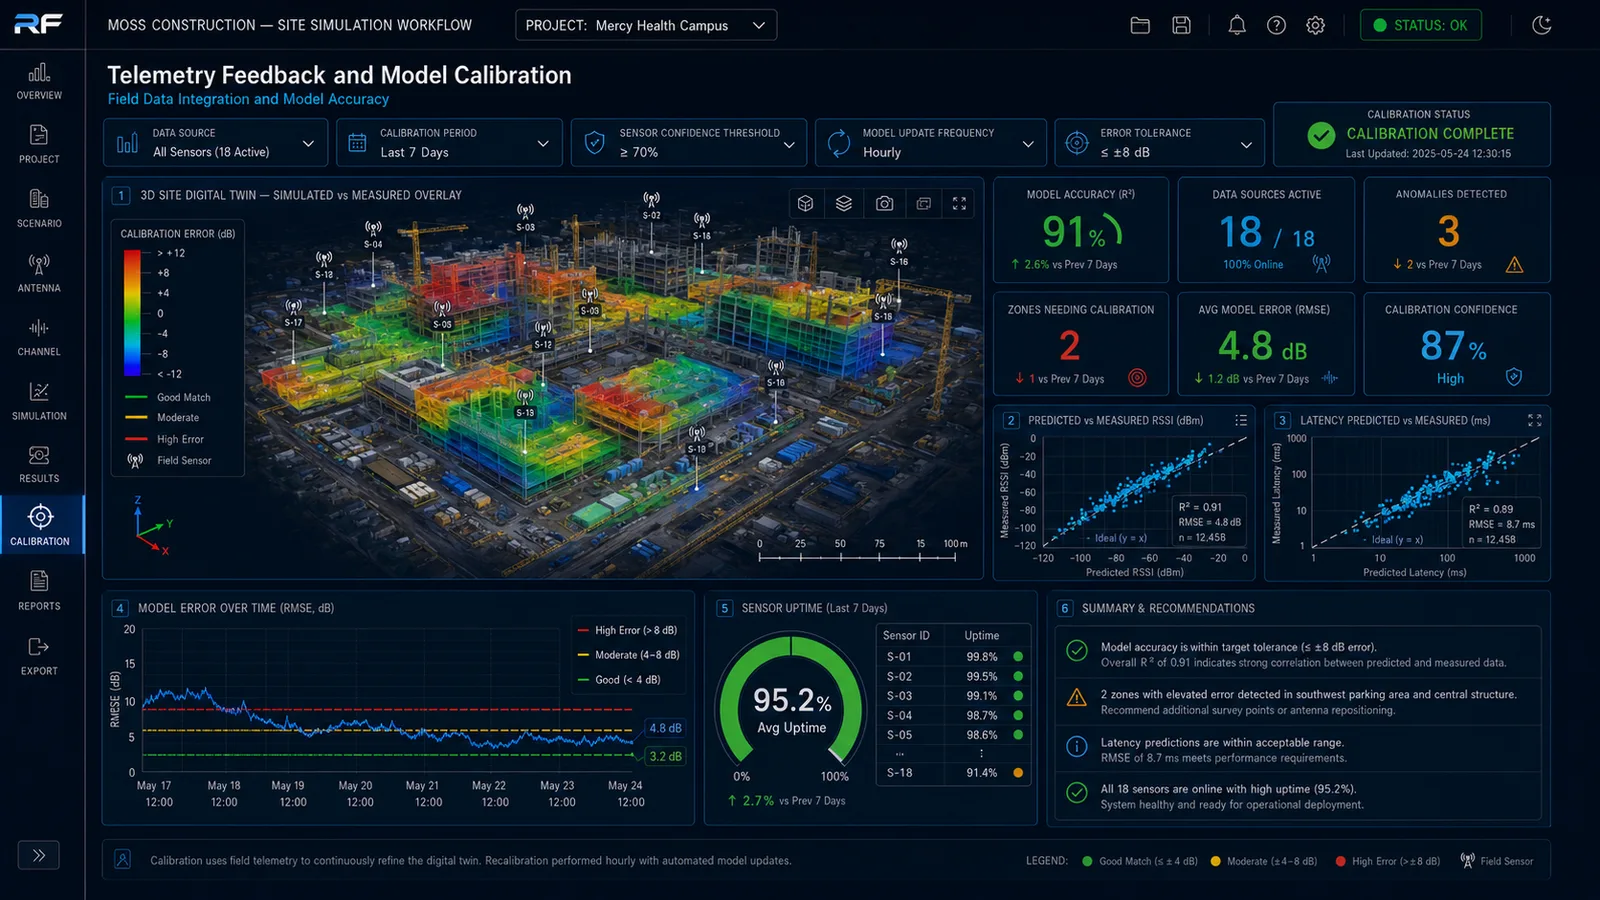
Live telemetry from site sensors, Wi-Fi access points, access-control systems, crane sensors, and field measurements is compared against predicted performance. Simulated-versus-measured overlays, model accuracy metrics, and calibration confidence scores show where the model is correct and where it needs refinement.

Each project becomes structured knowledge that improves the next forecast. The simulation library compounds across the contractor's portfolio rather than starting from scratch each time.

Telemetry feedback and model calibration
FIG 09Telemetry Feedback & Model Calibration · Simulated vs. Measured Overlay · Model Accuracy · Calibration Confidence

NoteActual outputs compare predicted and measured performance using telemetry from active site sensors, Wi-Fi logs, access-control systems, crane data, and field measurements.

Decisions before the field

The simulation stages feed a small set of consequential decisions. The outcomes below are what a project team carries into preconstruction, into the field, and into bid pursuits that follow.

01 /Trade-Conflict Elimination
Surface clashes in the model, not on the slab.

Trade conflicts such as overlapping work zones, equipment paths that block crews, and scaffolding that prevents access surface in the simulation rather than during execution. Time lost to trade standby, equipment idle, and rework from clash-driven mistakes is recovered. The schedule the project plans around becomes a schedule the field can actually hold, not one that absorbs slippage in contingency.

02 /Schedule and Phase Planning with Operational Realism
Model the site as it actually evolves week to week.

Temporary infrastructure such as power, RF coverage for cameras and tools, crane swing, equipment routes, and material staging is modeled against the site as it evolves through phases, not against the final-state plan. Phase transitions that look smooth on paper but produce field problems are surfaced before they happen. The result is a phase plan that survives contact with the field, and operations decisions that anticipate the conditions crews will actually encounter.

03 /Owner and Architect Communication
A shared substrate for the difficult conversations.

Change orders, schedule renegotiations, and design-intent disputes go more smoothly when all parties are looking at the same modeled site rather than at separate mental models. Simulation outputs become the shared substrate for those conversations, which shortens the cycle from issue identification to documented agreement. Owners and architects engage with the technical decisions because the material is built for non-specialist audiences.

04 /Bid Competitiveness
Defend tighter schedules and tighter contingency.

Bids backed by simulation can commit to tighter schedules and tighter contingency than bids backed by experience alone, because the analysis supports the commitment. Over time, completed projects feed measured performance back into the bid model. The operator's win rate on competitive work improves and margin on delivered work tightens, a feedback loop that compounds across the portfolio.

Where simulation does not solve the problem alone

Simulation does not replace supplier commitments, permitting timelines, crew judgment, or unforeseen site conditions. The boundaries below are explicit so the deliverable is read accurately.

01 /Tighter Coordination Does Not Eliminate Schedule Risk
A coordinated simulation does not fix a schedule whose critical path is determined elsewhere.

Simulation reduces conflicts that are visible in geometry, infrastructure, and trade interaction. Schedule risk that comes from supplier delays, weather, permitting timing, or owner-side decision latency is not addressed by the model. A well-coordinated plan still depends on external commitments holding.

02 /Field Behavior Has a Human Component
Crews, foremen, and trades make decisions the model does not represent.

Trade behavior, foreman judgment, crew morale, and the informal coordination that happens on a real site are outside the simulation. The model can show where conflict is likely; it cannot predict how a specific crew will sequence their work, when they will pull off site, or which conflict will be absorbed informally and which will become a change order. Field intelligence remains required to interpret model output.

03 /Unforeseen Site Conditions Are Out of Scope
The model accounts for the site as described, not for what is discovered mid-construction.

Existing conditions discovered during demolition, subsurface conditions uncovered during excavation, hidden utilities, and structural surprises are by definition outside the input model. The simulation can be updated when new information arrives, but it cannot foresee what the field has not yet exposed. Routine reconnaissance, surveys, and probing remain the way to surface these before they affect downstream phases.

Integrating Simulation into Construction Site Delivery

Simulation is integrated at the construction planning layer, before trade sequencing is locked or temporary network infrastructure is purchased. Each engagement begins with a scoping call to define the operating envelope: project size and phase plan, site geometry, trade mix, equipment fleet, temporary connectivity needs, access-control coverage requirements, and the deadlines the deliverable must support.

Site geometry, phased construction states, and the temporary RF environment are then captured as a working model, and the simulation stages run against the actual phases the project expects to execute. Deliverables include the site geometry and phased construction digital twin, temporary network and field infrastructure placement plan, crane, trailer, camera, and access-control coverage analysis, dynamic RF and connectivity propagation predictions, workforce, equipment, and material flow simulation, multi-team coordination and trade-conflict analysis, schedule, logistics, and operational impact forecasts, and a written brief that documents the analysis for the project owner, general contractor, and insurance carrier.

As the project moves through phases, the planning record grows. Post-deployment telemetry from connectivity, coverage, and trade-conflict events informs the next phase of planning, and the simulation library becomes an internal asset that the GC carries from one project to the next.

Planning a Complex Build?

For general contractors, construction managers, and owners delivering vertical construction, infrastructure, industrial fit-out, or campus expansion, we bring layered simulation across site geometry, infrastructure, operations, and schedule, so coordination and connectivity decisions are made before they show up in the field.