Aviation Simulation

Airport Counter-UAS Planning

A planning engagement for airport counter-UAS deployments. Simulation is one stage of the workflow, used to select the right system, plan its deployment, identify weaknesses in the proposed configuration, and characterize performance under varying conditions before any sensor is procured or installed.

From physical scene to operational decision

Airport RF environments are dynamic, congested, and highly dependent on operational context. Hangars, aircraft, ground vehicles, fuel operations, maintenance activity, nearby urban infrastructure, and airspace movement all influence detection coverage, communication reliability, and operational visibility.

An antenna that performs well on a bench may behave differently mounted on an aircraft in a hangar. A sensor that covers its field of view in isolation may become blind during peak ramp operations. A coverage map produced without accounting for aircraft movement or urban interference may look complete and still miss the drone.

A layered simulation sequence matters here because airport performance failures rarely come from one isolated cause. Simulation that stops at any one of those layers produces a technically attractive but operationally misleading result.
Every layer changes the answer

The simulation sequence starts with physical scene construction, then adds dynamic airport assets, RF propagation, sensor placement, drone flight paths, urban interference, operational transitions, sensor fusion, and telemetry calibration. Skipping any layer can produce false confidence. A static coverage map produced without aircraft movement overestimates sensor reliability during ramp operations. A sensor placement decision made without the obstruction baseline puts sensors where the model says to place them, not where the airport actually allows signals to pass.

The sequence is also how the operational consequence becomes visible. Coverage alone does not show whether a drone is detected early enough to support a response. Alert count alone does not show whether those alerts are trustworthy. Link margin alone does not show whether it holds through the hangar door. Each layer answers a question the previous layer cannot, and together they form a simulation grounded in the actual operating environment rather than in idealized assumptions.

Seven stages. Each one answering a different question.

The simulation moves through the airport from physical scene to operational decision. Each stage below produces a specific artifact and answers a specific operational question. Figures shown are representative. Actual outputs are produced against the specific airport, sensor inventory, and operating environment being modeled.

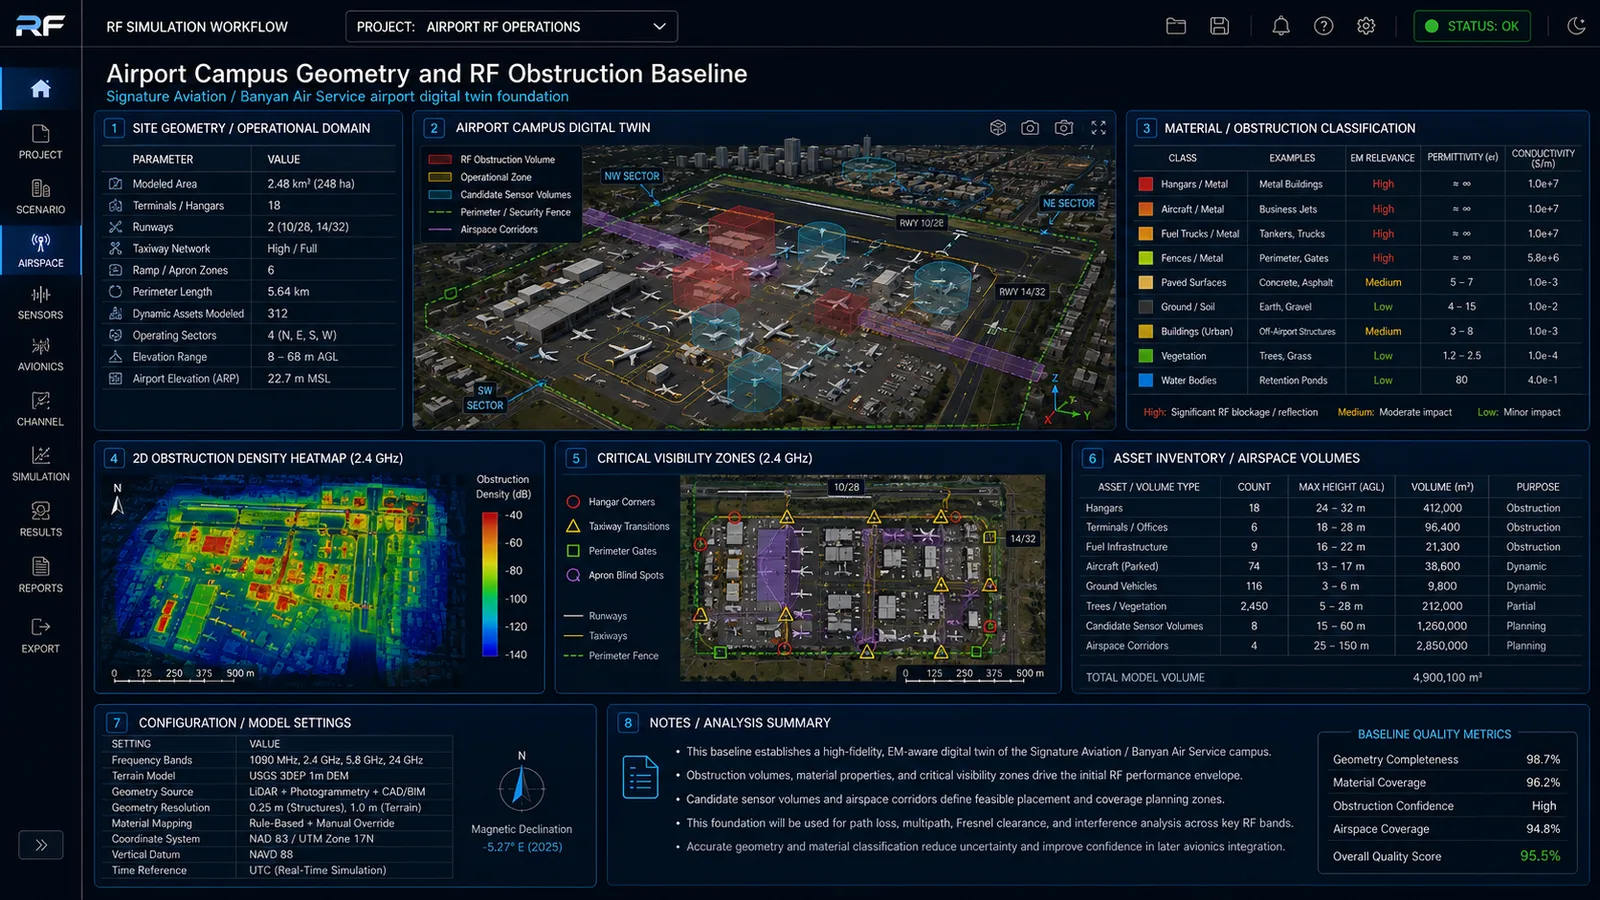
01 /Airport Campus Geometry and RF Obstruction Baseline
Physical and operational baseline before RF results are trusted.

The simulation begins with a detailed 3D airport campus scene: hangars, ramps, taxiways, fuel farms, parked aircraft, service vehicles, perimeter fencing, lighting structures, maintenance buildings, and surrounding urban RF emitters. Airport geometry is the propagation environment. Obstruction volumes, material classifications, candidate sensor zones, aircraft movement corridors, and base RF environment layers all derive from this foundation.

Without this layer, later results may appear precise but will not be physically meaningful. Coverage maps built on incomplete or incorrect geometry routinely mislead sensor placement and deployment decisions.

Airport campus geometry and RF obstruction baseline
FIG 01Airport Campus Geometry & RF Obstruction Baseline · 3D Campus Digital Twin · Obstruction Density · Material Classification

NoteActual outputs reflect the specific airport's geometry, hangar positions, taxiway layout, obstruction materials, and RF environment built from project data.

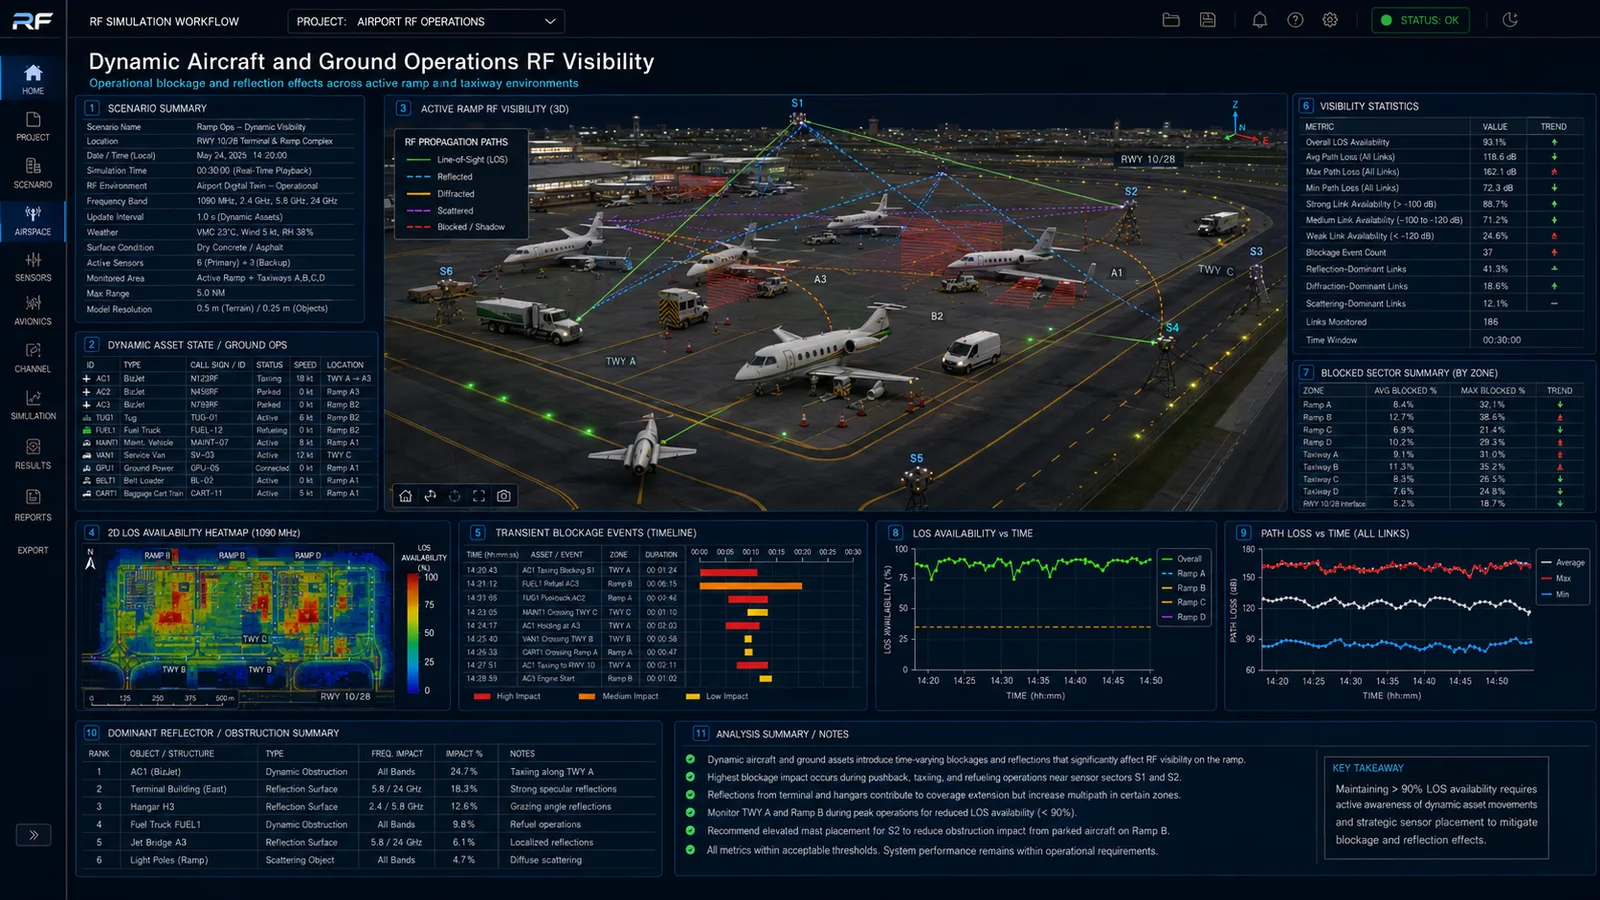
02 /Dynamic Aircraft and Ground Operations RF Visibility
Aircraft and vehicles reshape RF visibility throughout the operating day.

Aircraft bodies, tails, wings, jet engines, service trucks, fuel vehicles, tugs, and maintenance equipment are dynamic RF scatterers and blockers. Airport RF conditions change throughout the operating day. A sensor placement that looks effective in a static model may fail during peak ramp operations when aircraft are taxiing, parking, and being serviced simultaneously.

This stage models dynamic obstruction states, multipath reflection maps, line-of-sight availability over time, and RF visibility variation by operating condition. The LOS/NLOS transition map, visibility percentage over time, and blocked-sector views answer whether sensor coverage holds up during realistic ramp activity, not just in the empty-ramp baseline.

Dynamic aircraft and ground operations RF visibility
FIG 02Dynamic Aircraft & Ground Operations RF Visibility · Active Ramp RF Visibility · LOS Availability Over Time · Transient Blockage Events

NoteActual outputs model dynamic blockage and reflection from the specific aircraft types, parking configurations, and service vehicle routes at the airport being modeled.

03 /Drone Detection Sensor Placement and Blind-Spot Analysis
Candidate sensor locations evaluated for coverage, redundancy, and gaps.

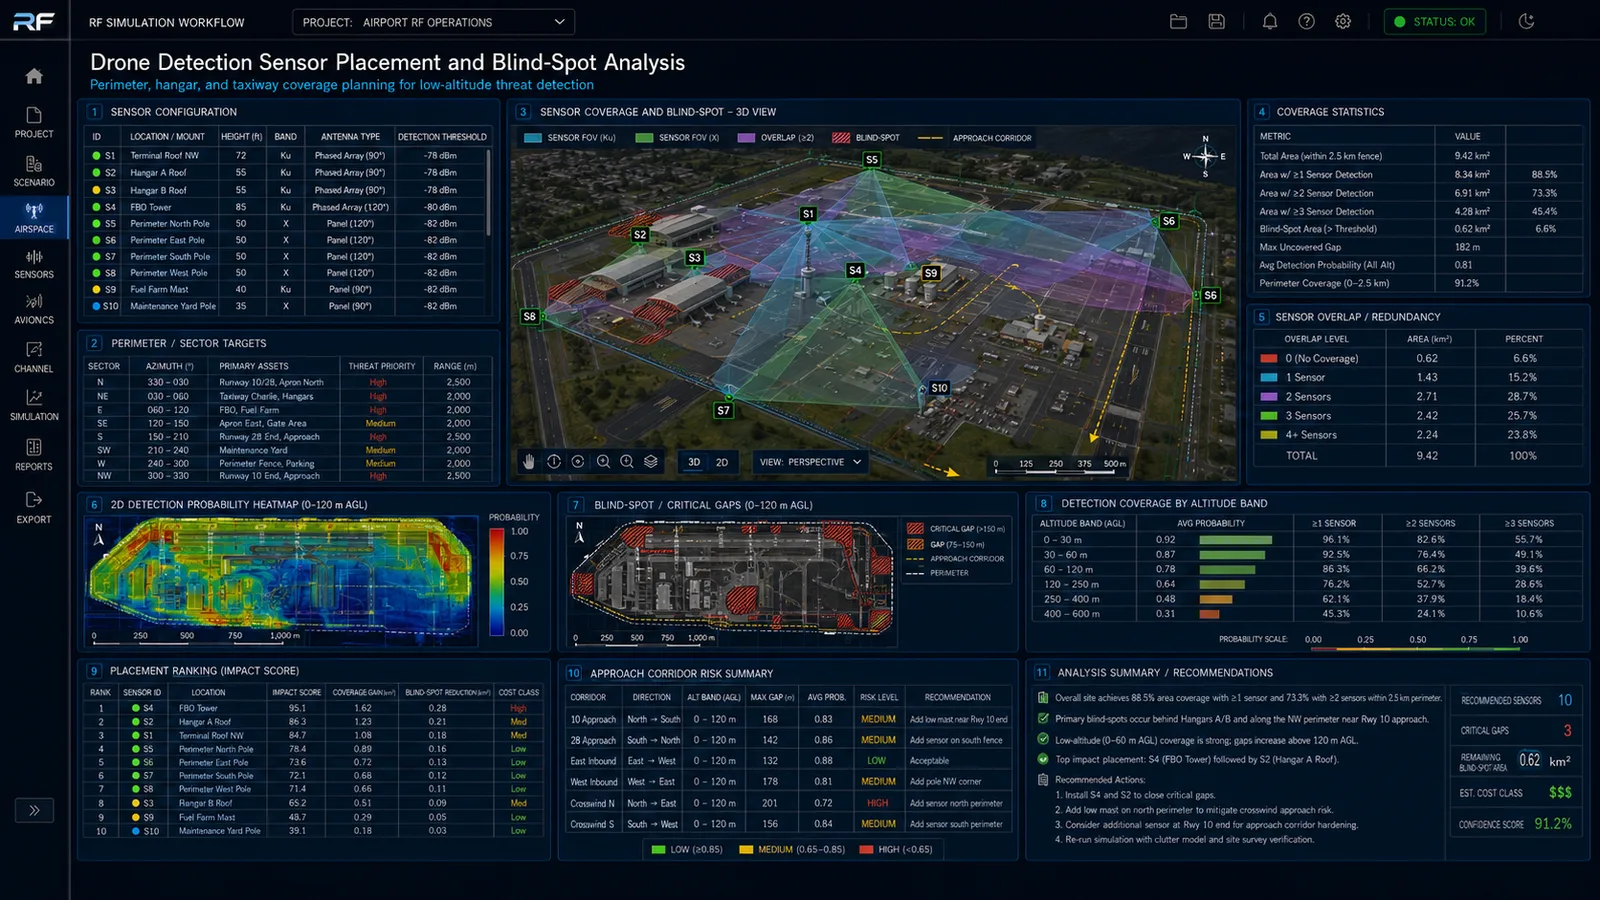
Candidate sensor locations such as hangar roofs, hangar corners, perimeter structures, ramp-facing poles, taxiway-adjacent mounts, and approach-facing positions are evaluated against the airport obstruction model for detection range, line-of-sight coverage, blocked sectors, overlapping sensor fields, and blind spots. Detection probability heatmaps, blind-spot overlays, sensor overlap matrices, and placement ranking by impact score support installation decisions before hardware is mounted.

This stage reduces the risk of leaving critical approach corridors uncovered. A perimeter fence sensor that appears adequate in a flat coverage view may have its field of view clipped by a hangar corner in the 3D obstruction model. Placement decisions made here, before procurement, are far less expensive to change than placement decisions discovered in the field.

Drone detection sensor placement and blind-spot analysis
FIG 03Sensor Placement & Blind-Spot Analysis · Coverage Volumes · Detection Probability Heatmap · Blind-Spot & Approach Corridor Overlays

NoteActual outputs evaluate the specific sensor types, mounting locations, antenna patterns, detection thresholds, and altitude bands against the airport's actual obstruction model.

04 /Low-Altitude Drone Route Detection and Response Window Analysis
Detection probability and response time along realistic threat paths.

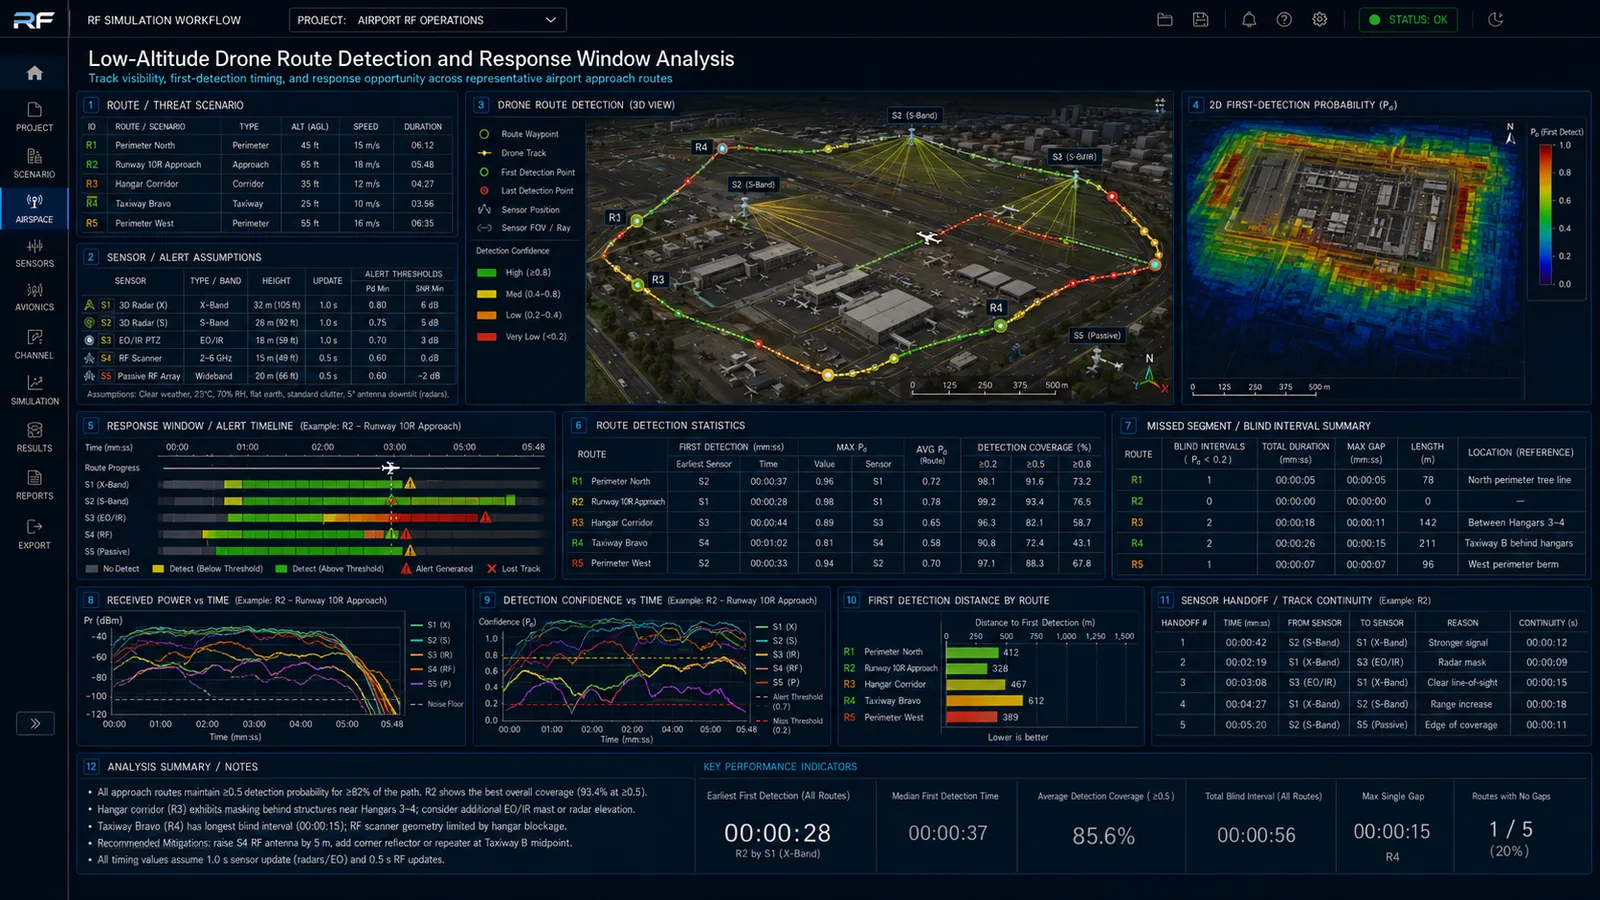
A coverage map alone does not show whether a drone is detected early enough to support operational response. This stage evaluates drone trajectories at varying altitudes, speeds, headings, and approach paths, including perimeter approach, parking-lot launch, rooftop approach, approach-corridor crossing, and hangar-shadowed routes. The simulation answers when and where the drone becomes visible to each sensor, how long detection is continuous, and what response-time window remains after first detection.

Detection timeline, first-detection point, detection continuity, missed segments, and sensor handoff views convert coverage into decision time. A route with nominally adequate coverage may still produce a missed interval that exceeds the response window.

Low-altitude drone route detection and response window analysis
FIG 04Approach Routes & Response Window · Route Detection Statistics · First-Detection Timing · Missed Segments · Sensor Handoff

NoteActual outputs model detection probability and response window along drone routes defined for the specific airport perimeter, approach corridors, and threat profile being modeled.

05 /Airport Spectrum Interference and Receiver Desensitization Analysis
RF congestion, SINR degradation, and false-alarm risk across the campus.

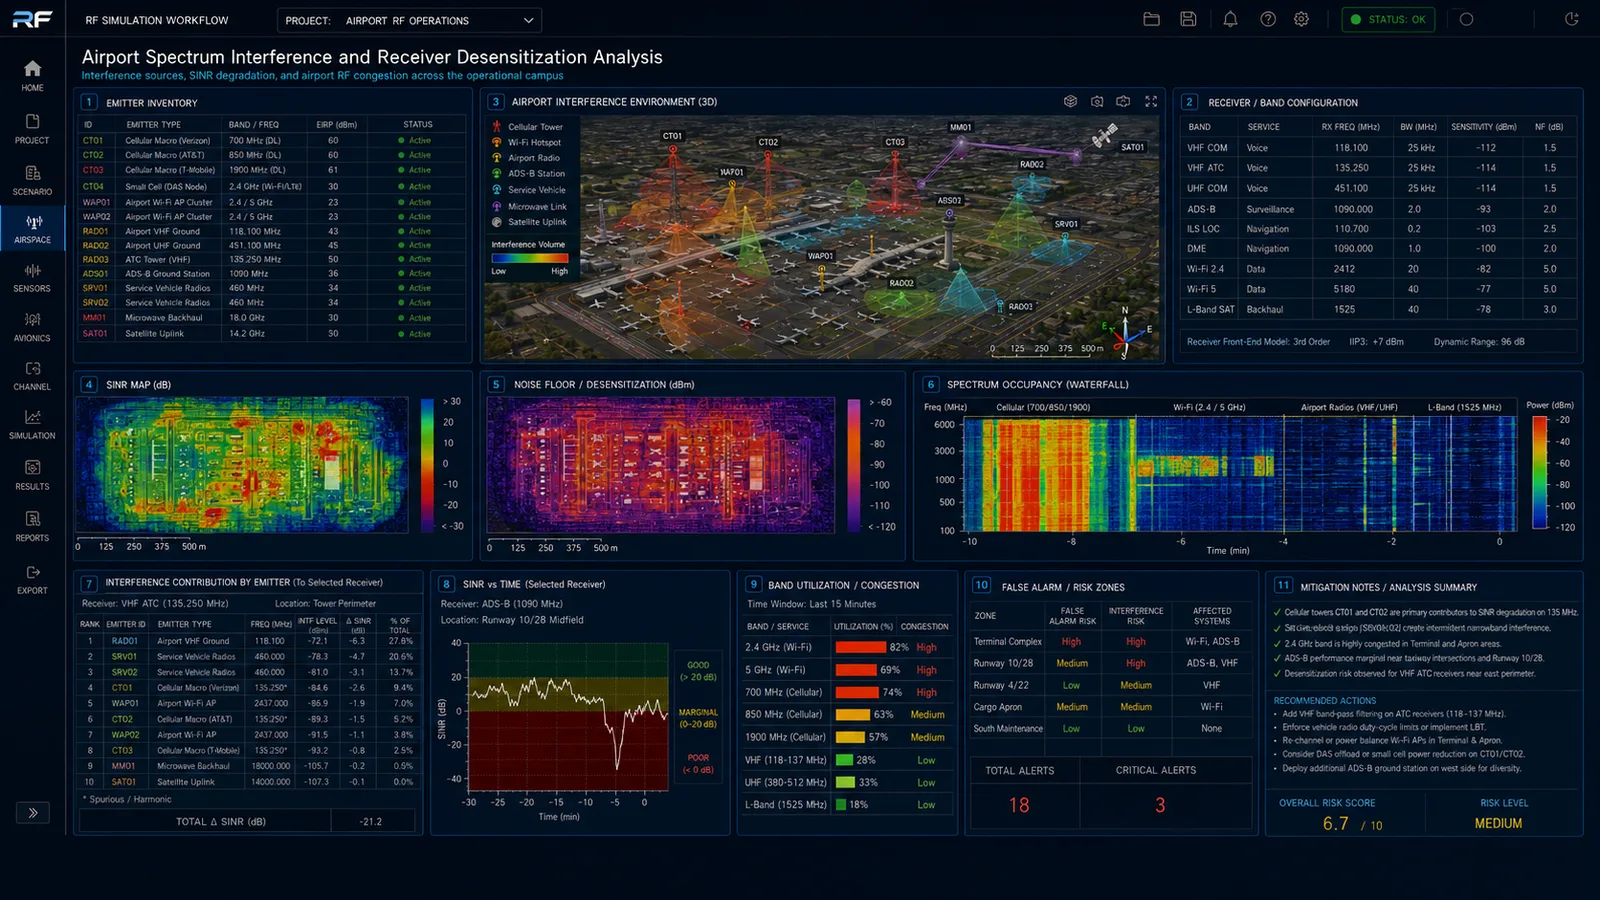
A sensor that performs well in isolation may degrade when exposed to the full airport RF environment. Aviation communications, ADS-B infrastructure, Wi-Fi, cellular towers, weather systems, maintenance equipment, vehicle radios, and urban wireless systems all contribute to the noise floor. This stage evaluates interference sources, SINR maps, noise-floor heatmaps, spectrum occupancy, receiver desensitization zones, and false-alarm risk zones across the operating bands.

Interference contribution by emitter, SINR over time at selected receivers, and band utilization plots support operating-band planning, filter selection, interference mitigation, and troubleshooting. Zones where SINR falls below detection thresholds are identified before the system is deployed.

Airport spectrum interference and receiver desensitization analysis
FIG 05Spectrum Interference & Receiver Desensitization · SINR Map · Noise Floor Heatmap · Spectrum Occupancy · Emitter Contribution

NoteActual outputs model interference from the specific emitter inventory, operating bands, power levels, and antenna heights against the sensors deployed at the airport being modeled.

08 /Multi-Sensor Fusion and Drone Alert Confidence Evaluation
From raw detections to reliable operational alerts.

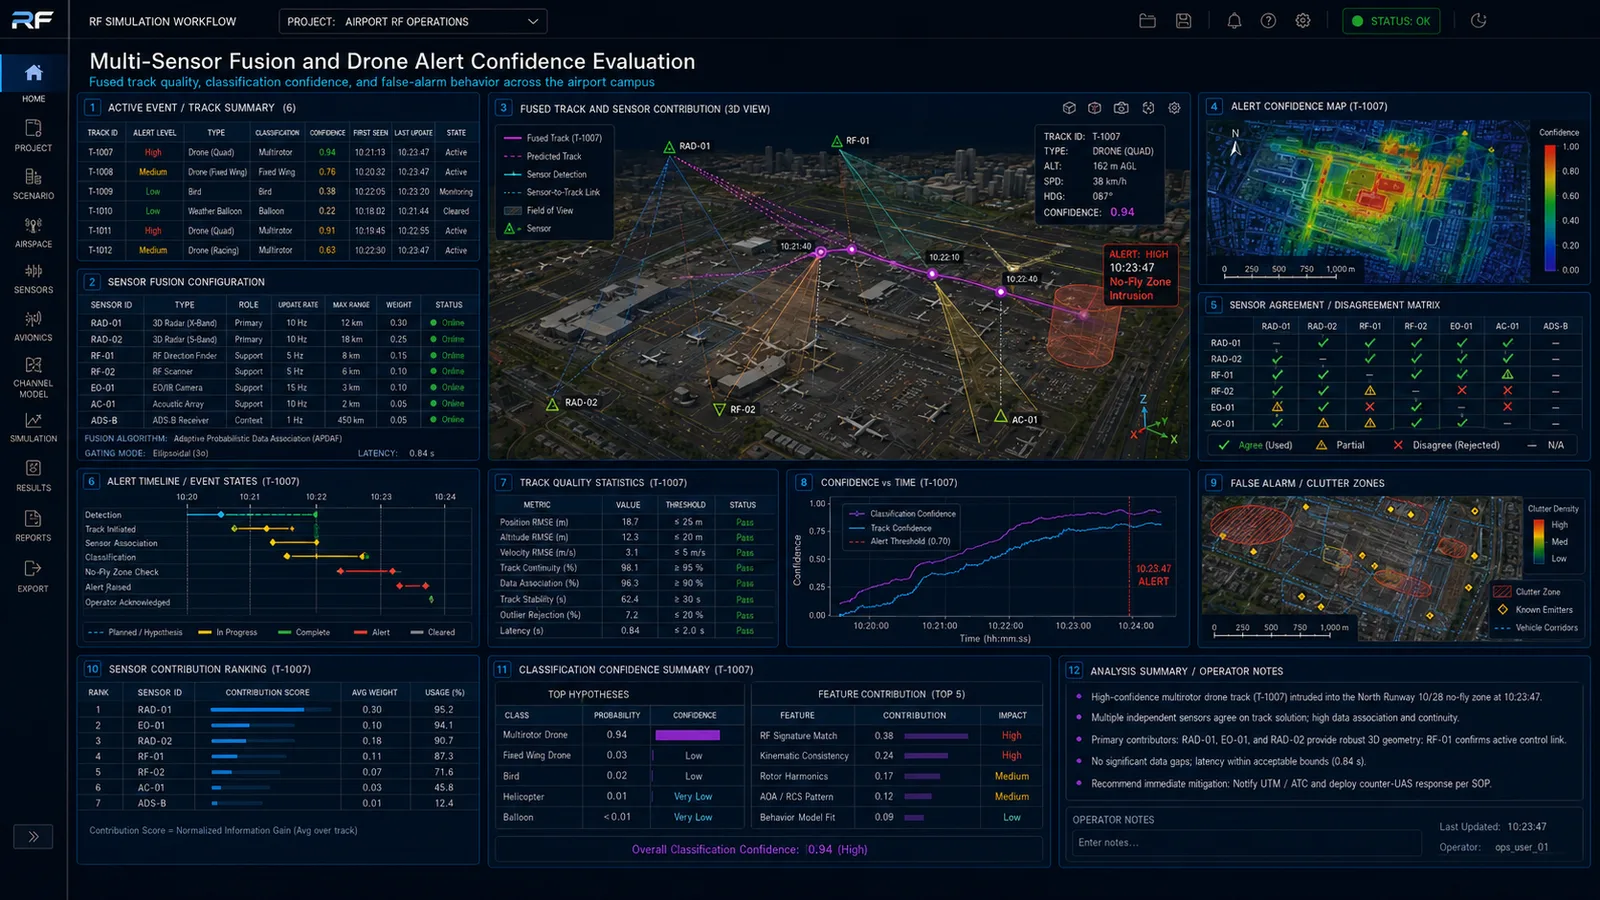
Coverage does not guarantee alert quality. Multiple detection sensors must combine their detections into a reliable operational alert while suppressing false positives from birds, vehicles, weather balloons, and other non-threat objects. This stage evaluates sensor agreement, track confidence, alert latency, false-alarm zones, classification uncertainty, and confidence scoring across the active sensor network.

Track confidence over time, sensor agreement matrix, false-alarm heatmap, alert timeline, and classification confidence chart connect sensor design to operational decision quality. A fused track with high classification confidence and strong sensor agreement produces an alert the operator can act on. A track with weak agreement or poor classification confidence does not.

Multi-sensor fusion and drone alert confidence evaluation
FIG 08Sensor Fusion & Alert Confidence · Fused Track Quality · Sensor Agreement Matrix · Alert Timeline · Classification Confidence

NoteActual outputs evaluate fusion performance for the specific sensor types, placement, detection thresholds, clutter environment, and alert configuration of the deployment being modeled.

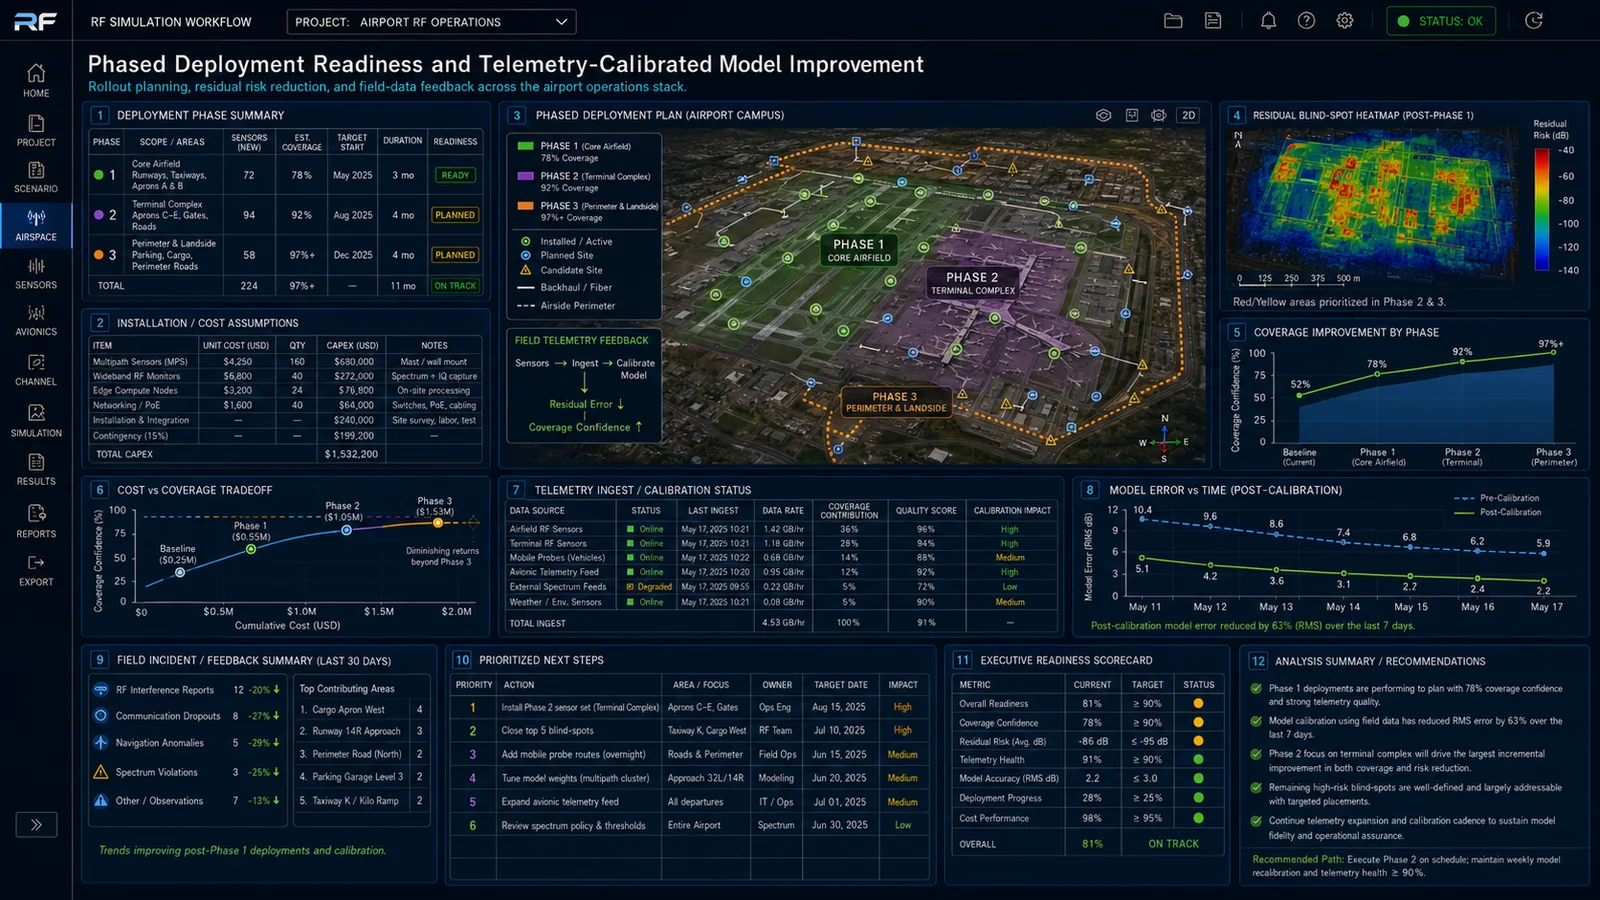
09 /Phased Deployment Readiness and Telemetry-Calibrated Model Improvement
Deployment roadmap and continuous model improvement from live data.

The final stage turns the simulation into a deployment and continuous-improvement tool. Phased sensor rollout, coverage improvement over time, response workflows, telemetry feedback, maintenance updates, and model refinement from live data are evaluated together. Deployment phase maps, coverage improvement curves, cost-versus-coverage plots, residual blind-spot heatmaps, and calibration timelines support investment decisions, phased installation, and operational readiness assessment.

Post-deployment, telemetry from sensor detections, missed detections, false alarms, received-power measurements, spectrum surveys, ADS-B logs, aircraft movement records, and operator incident reports is compared against predicted behavior. When the model diverges from operation, calibration updates close the gap and the planning library grows.

Phased deployment readiness and telemetry-calibrated model improvement
FIG 09Phased Deployment & Telemetry-Calibrated Model Improvement · Phase Coverage Plan · Cost vs. Coverage · Residual Blind-Spot Heatmap · Calibration Schedule

NoteActual outputs model the specific deployment phases, sensor cost assumptions, installation constraints, telemetry feeds, and field-measured performance data of the airport being modeled.

Coverage you can defend before deployment

The simulation stages feed a small set of consequential decisions. The outcomes below are what an airport carries into procurement, into FAA review, and into long-term operation. They are the deliverables that justify the planning engagement.

01 /System Selection
Choose the right counter-UAS modality mix for this airport, not the generic one.

RF sensing, radar, EO/IR, acoustic, and hybrid systems each behave differently against an airport's geometry, threat profile, and existing spectrum environment. The simulation surfaces which modalities and which vendor capabilities the airport actually needs, and which would be over-spec or under-spec for the operating envelope. Procurement decisions are anchored to evidence rather than vendor data sheets.

02 /Deployment Planning
Where sensors go, in what order, and how they integrate with what's already on site.

Sensor placement is ranked against the obstruction model, response-window analysis, and operational geometry. The deployment plan covers mounting positions, phased install sequence, integration with existing security and airfield infrastructure, and the coverage uplift each phase delivers, so install crews and ops teams arrive at a plan that has already been pressure-tested in the model.

03 /Weakness & Failure-Mode Identification
Surface the blind spots, marginal sectors, and false-alert conditions before they reach the field.

Blind spots driven by hangar corners, parked aircraft, or terrain are surfaced in the obstruction model. Marginal SINR zones, dropout-risk segments along approach routes, and configurations prone to false alerts from birds, ground vehicles, or weather balloons are identified before procurement. Hardware that would have been installed in low-value positions is redirected to positions the model says will hold up under operational conditions.

04 /Performance Under Varying Conditions
Characterize how the deployment behaves across operating tempo, weather, spectrum activity, and threat profile.

An airport at 6am with an empty ramp is a different RF environment than the same airport at peak ops. Coverage that holds in clear conditions may shift under rain, fog, or seasonal foliage; alert quality that works against a hobbyist drone may not hold against a modified airframe. The simulation runs across operating envelopes including ramp tempo, weather states, spectrum congestion, and threat profiles, so the system's performance is characterized as a curve, not a single number.

05 /Regulatory & Insurance Documentation
Documented analysis that shortens review cycles.

FAA, ICAO, and local-authority reviews of perimeter detection ask for documented coverage analysis. Insurance carriers ask for evidence of considered risk. Planning outputs are that analysis, presented in a form regulators and underwriters recognize. Deployments submitted with this documentation move through review faster, with fewer conditions attached, and with a clearer record for the next review when conditions or threat models change.

Where simulation does not solve the problem alone

Simulation does not replace operational decisions, threat characterization, or live spectrum surveys. The boundaries below are explicit so the deliverable is read accurately.

01 /Detection Coverage Is Not Detection Outcome
Coverage tells the system where a drone could appear. Response is a separate problem.

Detection coverage shows where the sensor network can observe a drone. Whether the drone is intercepted, neutralized, or simply documented depends on response capability, alerting workflows, security staffing, and rules of engagement, none of which are inside the RF simulation. A well-modeled sensor footprint that lands at an airport without a tuned response plan can still leave operations exposed.

02 /Adversarial and Atypical Drones Are Not Modeled
The simulation assumes drones behave like the ones we have characterized.

Detection performance is evaluated against drone signatures that have been measured or specified. Adversarial drones that intentionally fly silent, modulate their RF emissions to avoid detection, operate near or below the receiver noise floor, or use atypical airframes and propulsion are outside the model. New drone types, especially purpose-built or modified airframes, may have signatures the model does not yet represent.

03 /Unknown Interference Sources Are Out of Scope
The model accounts for known emitters, not unidentified ones.

Interference simulation is bounded by what is known. The model can include documented avionics traffic, planned ground systems, known incumbent emitters, and previously observed interference at the airport. It cannot foresee unknown interferers, transient emitters, or new RF sources installed at neighboring properties. Spectrum sweeps and post-deployment telemetry are the way to identify them, after which they can be incorporated into subsequent simulation runs.

Integrating Simulation into Drone Defense Deployments

Simulation is integrated at the airport planning layer, before sensor placement is committed or detection coverage is reported to airfield operations. Each engagement begins with a scoping call to define the operating envelope: airport class, existing detection assets, threat surface, candidate sensor positions, hangar and ramp geometry, and the regulatory framework the deliverable must satisfy. Site geometry, installed avionics antenna configurations, and the local RF environment are then captured as a working model, and the simulation stages run against the actual detection cases the airport expects to face.

Deliverables include the airport campus digital twin and RF obstruction baseline, sensor placement and blind-spot analysis, drone-route detection-window predictions, spectrum coexistence and receiver-desensitization analysis, multi-sensor fusion confidence evaluation, and a written brief that documents the analysis for airfield operations, the FAA, and the airport's insurance carrier.

As the airport's detection program operates over more events and seasons, the planning record grows. Post-deployment telemetry from detection events and sensor health data informs the next round of planning, and the simulation library becomes an internal asset the airport carries from one phase of deployment to the next.

Planning Counter-UAS at Your Airport?

Whether you operate a commercial airport, a general aviation field, or a military airfield, we bring layered simulation, RF expertise, and sensor-system design to drone-detection planning, so system selection, deployment plan, and performance envelope are evidence-backed before the first sensor is procured.